
3Q 2022

Click image to enlarge
On June 13, 2022, the S&P 500 dropped more than 20% from its January 3, 2022, all-time high.
Inflation, Russia, and the pandemic could send stocks tumbling further, and it’s a time of high financial anxiety.
This presentation provides performance data framed from the perspective of a financial professional.

Click image to enlarge
2022 had already been a bad year for investors before the bear market officially began on June 13th..
Inflation for months has been running at its highest rate in four decades, and the European Union’s ban on Russian oil, along with a decrease in oil production by OPEC. Energy prices could head higher this winter.

Click image to enlarge
Stocks posted a loss of -4.9% in the third quarter, fo0llowing a -16.1% loss in the second quarter of 2022, which followed a -4.6% loss in the first quarter of 2022.

Click image to enlarge
The extraordinary events we’ve all been living through since the start of 2020 have whipsawed investors.
In the first quarter of 2020, the S&P 500 plunged.
The -19.6% loss in stocks that quarter was actually much worse than it appears in this table.

Click image to enlarge
Looking back at the price chart, at the tail end of the first quarter of 2020, stocks had declined by as much as -34% on March 19, 2020, before rebounding to end the quarter with a loss of “only” -19.6%.
That big bear market loss set the stage for a spectacular seven-quarter bull market run that peaked January 3, 2022.

Click image to enlarge
Stock prices soared every quarter from the second quarter of 2020 to the end of 2021.
This was followed by three straight losing quarters in 2022.

Click image to enlarge
Let’s talk about stock market volatility because we’ve seen some extraordinary volatility lately.
And the point that I’ll repeat today is: Remember the basic axiom of investing in common stocks.
It’s that volatility goes with the territory. If you want the so-called equity risk premium, then you have to expect stock market volatility and, in fact, welcome stock market volatility.
Because without volatility, you wouldn’t get the 6-percentage-point excess return over fixed income that we’ve gotten from common stocks in the long term.
The nominal return on common stocks has been about +10% over the long term, and the number in fixed income has been about 4%. And, again, that’s nominal, not a real, after-inflation return.
So 6 percentage points is the equity risk premium, and the only reason you get that is because you’ve exposed a portion of your portfolio, the stock portion of your portfolio, to volatility.
So, it’s just so important to be able to explain to people, “Yes, we’ve entered a period of heightened volatility here. You can see that volatility is up, generally, from where it was.
We had an extraordinary period of low volatility for a number of months last year. Volatility is surging, and we don’t like it when stocks are down 600 or 800 points on the Dow. But without that periodic cleansing, if you will, you wouldn’t get the long-term returns that we’ve gotten in stocks.”

Click image to enlarge
As the bear market grinds on and portfolio statements are a little frightening to look at, it can make you wonder if stocks are worth the risk?
Here’s the answer.
The equity risk premium measures the reward received for tolerating the risk of owning stocks, and it’s an important investment metric to remember in bear market moments like this.
Illustrated here, is the average annual equity risk premium for the 20-year period ended September 31, 2022
Stocks, as measured by the Standard & Poor’s 500, averaged a 9.8% annual return in the 20 years — more than seven times the 1.2% annual return on risk-free 90-day U.S Treasury bills.

Click image to enlarge
T-bills are considered a risk-free investment because they’re backed by the full faith and credit of the United States Government.
In contrast, stock market investments are not guaranteed.
Stock prices fluctuate, depending on the economy and investor sentiment and are subject to unpredictable swings up and down.
In theory, if all 500 blue-chip companies in the S&P 500 index were to go bust, your entire investment would be lost.
So that’s why stocks are considered risky.

Click image to enlarge
Subtracting the annual return on T-bills from the return on stocks, the resulting 8.7% is the premium paid annually for taking the risk of owning U.S. stocks over the 20 years.
To be clear, investing in America’s 500 largest publicly held companies in the past 20 years earned an average of 8.7% more annually than a risk-free investment.

Click image to enlarge
This 20-year period encompassed fourbear markets — the tech crash of 2002, the financial crisis of 2008, the COVID downturn of February 5 through March 23, 2020, and the current post-Covid downturn now under way, so investors were subjected to plunges of more than 30% in the worst bear markets.

Click image to enlarge

Click image to enlarge

Click image to enlarge

Click image to enlarge

Click image to enlarge

Click image to enlarge

Click image to enlarge

Click image to enlarge

Click image to enlarge

Click image to enlarge

Click image to enlarge

Click image to enlarge

Click image to enlarge

Click image to enlarge
1Q 2022

Click image to enlarge
Snapping a seven-quarter win streak, the stock market suffered a -4.6% lossin the first quarter of 2022.
The last losing quarter for the S&P 500 was the first quarter of 2020, when the pandemic hit, and wiped out 20% of the value of stocks.

Click image to enlarge
The stock market has been more volatile, as inflation has raged stronger than in four decades, and the Ukraine invasion exacerbated the situation by causing oil prices to rise higher.
One quarter is a snapshot in time. You cannot read much into a a single quarterly performance number.

Click image to enlarge
Here’s a long-term picture of the S&P 500.
By our count, since 1957, 27 crises have come and gone.
The U.S. stock market, the main equity-building investment of the world, has continued to rise despite the onslaught of crises that have plagued modern history.
We suggest thinking of the inflation crisis of 2022, which comes on the heels of the Ukraine crisis, a test.
Selling stocks in the midst of a crisis is very likely to result in missing the recovery.
History indicates that the best strategy for long-term wealth-building is to stay put, even if it’s hard to do.

Click image to enlarge
Here’s more perspective for how this quarter fits in with the long-term history of stock investing.
This table shows how often a losing quarter has occurred since 2015.
The period here includes two spectacular bull runs and two bear markets.
The stock market since 1926 has averaged slightly more than a +10% annualreturn.
That’s about an average return of +2.5% per quarter since the inception of Wall Street and the modern stock market.
This table shows the returns in each of the last 29 quarterly periods, seven and one-quarter years.
In the past 29 quarters, the return on stocks was +2.5% or more 19 times. The average quarterly return was less than 2.5% in 10 of the past 29 quarters.
To be clear, two-thirds of the past 29 calendar quarters showed above-average returns.
Amid a period of above average returns. the market loss of -4.6% in the first quarter may not seem like such a bad loss.
But past performance is a not a guarantee of future results, and there is a risk the pattern of intermittent losses shown here will not be repeated.
That risk is precisely why the stock market has rewarded investors with much greater returns than risk-free government backed Treasury Bills for many decades!

Click image to enlarge
With the 12-month inflation rate at its worst in 40 years, the Federal Reserve hiking interest rates, Russian dictator Valdimir Putin threatening the American-built geopolitical balance in place since World War Two, investing in stocks may seem riskier than normal but keep things in proper perspective:
The U.S. stock market is always risky and unpredictable and that’s why it’s been such a profitable long-term investment for nearly a century; stocks represent just one investment in a diversified portfolio, key fundamentals driving economic growth are strong, and since the March 23, 2020 bear market low, the S&P 500, America’s largest publicly investable companies, is up 68%!
Stocks, as measured by the Standard & Poor’s 500, in the 20 years ended March 31, 2022, averaged a +9.3% annual return, nearly seven times the +1.2% annual return on the risk-free 90-day U.S Treasury Bill. Backed by the full faith and credit of the U.S. Government, T-Bills are considered a riskless investment, while the value of stocks is subject to ups and downs and, in theory, your entire investment could be lost in stocks.
Subtracting the return on T Bills from the return on stocks, the resulting 8.1% is the premium paid for taking the risk of owning U.S. stocks over the 20-years. To be clear, investing in America’s 500 largest publicly-held companies earned an average of 8.1% more annually than a risk-free investment in the past 20 years.
This 20-year period encompassed three frightening bear markets — the tech crash of 2002, the financial crisis of 2008, and the Covid downturn of early 2020.
Past performance is no guarantee of your future results and that, paradoxically, is precisely why investors are paid a premium for owning stocks.
Yes, stocks are risky and past performance is no guarantee of your future results! That is precisely why stocks have returned 8.3% more annually than U.S.-Government-guaranteed investments through three bear markets and financial crises of the past 20 years.

Click image to enlarge
As one might expect, the riskier stocks were hardest hit by the stock market pullback. Small-cap growth stocks declined in value by -9.5%.
Large-company stocks that are less dependent on growth declined the least, with the S&P 500 value stock index falling a scant two-tenth of 1% last quarter.

Click image to enlarge
Energy company stocks soared in value by 39%! Rising oil prices fatten profits. American energy companies could benefit from a European ban on Russian natural gas and oil. However, it takes months for U.S. energy companies to ramp up oil production and exports of natural gas.

Click image to enlarge
If you thought the U.S. stock market was hard hit by the continued disruptions caused by the pandemic, Chinese equities dropped more than three times as much.
China’s policy of zero-Covid tolerance has resulted in lockdowns for weeks in its largest cities, adding to manufacturing delays affecting consumers worldwide. Europe’s stock market index suffered on worries about the impact of banning imports or Russian oil. Germany, by far Europe’s largest economy, is heavily dependent on Russian oil.

Click image to enlarge
Of 13 distinctly different asset classes represented here by stock indexes, oil was No. 1 in the first quarter of 2022, with oil prices rising as Russia’s pariah status spread across the globe. Meanwhile, the world’s No. 2 exporter of grain behind the U.S., Ukraine, unexpectedly had to shut down its agriculture business to fight an existential battle for its statehood, which sent prices of agricultural commodities higher.
Fixed income investments lost -6.5% in the quarter and rising rates sent bond prices lower.

Click image to enlarge
Here’s a good way of looking at the first quarter loss of -4.6% on the S&P 500 stock index in an historical context.
The 10-plus year expansion that erupted after the global financial crisis of 2008 was a period of spectacular annual gains.
Then came 2021, when the Standard & Poor’s 500 stock index, with dividends reinvested, returned an astonishing 26.9%!
That was the third consecutive year of extraordinary gains for the stock market, especially when you consider 2020 was marred by the pandemic.
Keep in mind, the calendar-year returns don’t show the 33.9% drop in stocks in February and March 2020.

Click image to enlarge
Despite the first quarter loss of -4.6%, the S&P 500 stock index was up +15.7% in the 12 months ended March 31, 2022.

Click image to enlarge
In the 12 months ended March 31, 2022, stocks continued to beat bonds. Energy and commodities companies, which go in and out of fashion unexpectedly depending on supply disruptions and the economic cycle, beat stocks handily.
U.S. stocks bested foreign bourses in the 12-months, and large-cap growth stocks again led U.S. stocks when looked at based on market-capitalization and their growth versus value characteristics.

Click image to enlarge
After trading sideways for in 2015 and most of 2016, the stock market broke out after the November 2016 election. It rose steadily to new peak on September 20, 2018, and then nosedived -20% at the end of 2018 after the Federal Reserve hiked rates, which raised fears that an inverted yield curve was imminent. It was a Fed policy mistake, that was acknowledged by the Fed chief.
On January 4, 2019, the Fed signaled rates were on hold,. Stocks rallied for most of the remainder of 2019.
Stocks rallied and next peaked In February 2020. Then the COVID-19 virus threw the economy and stock market into a meltdown.
Government action to add liquidity to the economy through aid payments brought about a swift turnaround that began in late March.
By early September 2020, following the enactment of the CARES Act and related legislation, stocks hit a record all-time high.
After a pause, stocks rallied steadily from the November 2020 election through year-end.
The S&P 500 continued upward through the first quarter of 2021.
The March 2021 enactment of the $1.9 trillion American Rescue Plan Act extended the rally, which continued through the end of 2021 despite the Omicron COVID variant.
Stocks turned down in the first quarter of 2022 on Fed tightening and Russia’s invasion of Ukraine.
However, over the five years ended March 31, 2022, the S&P 500 total return index, including dividends, gained +110%.

Click image to enlarge

Click image to enlarge

Click image to enlarge
Click image to enlarge

Click image to enlarge
Russia is challenging world order, inflation is at a 40-year high, and a stock market correction has been underway. The relentless progress of the United States is being tested once again. Here’s an important perspective on this moment in financial history.
On March 23, 2020, the stock market bottomed. The Covid bear market had erased -33.9% of the value of the Standard & Poor’s 500.
In that moment, which preceded the advent of vaccines, no one knew the bear market was over. No one knew the stock market would appreciate by 71% in the next 21 months. In the throes of the Covid crisis, no one expected the U.S. government would embark on the largest transfer payments programs since The New Deal.
In that fraught time, no one predicted that the American consumer’s balance sheet, two years hence, would be stronger than ever in modern American history. Nor did anyone foresee that the Covid-19 would be managed much like the flu.
The difficulties are likely to hinder stock returns in the months ahead, which is why we have done our best in this presentation to help you look beyond this bleak moment in history.

Click image to enlarge
1Q 2022
Click image to enlarge
Snapping a seven-quarter win streak, the stock market suffered a -4.6% lossin the first quarter of 2022.
The last losing quarter for the S&P 500 was the first quarter of 2020, when the pandemic hit, and wiped out 20% of the value of stocks.
Click image to enlarge
The stock market has been more volatile, as inflation has raged stronger than in four decades, and the Ukraine invasion exacerbated the situation by causing oil prices to rise higher.
One quarter is a snapshot in time. You cannot read much into a a single quarterly performance number.
Click image to enlarge
Here’s a long-term picture of the S&P 500.
By our count, since 1957, 27 crises have come and gone.
The U.S. stock market, the main equity-building investment of the world, has continued to rise despite the onslaught of crises that have plagued modern history.
We suggest thinking of the inflation crisis of 2022, which comes on the heels of the Ukraine crisis, a test.
Selling stocks in the midst of a crisis is very likely to result in missing the recovery.
History indicates that the best strategy for long-term wealth-building is to stay put, even if it’s hard to do.
Click image to enlarge
Here’s more perspective for how this quarter fits in with the long-term history of stock investing.
This table shows how often a losing quarter has occurred since 2015.
The period here includes two spectacular bull runs and two bear markets.
The stock market since 1926 has averaged slightly more than a +10% annualreturn.
That’s about an average return of +2.5% per quarter since the inception of Wall Street and the modern stock market.
This table shows the returns in each of the last 29 quarterly periods, seven and one-quarter years.
In the past 29 quarters, the return on stocks was +2.5% or more 19 times. The average quarterly return was less than 2.5% in 10 of the past 29 quarters.
To be clear, two-thirds of the past 29 calendar quarters showed above-average returns.
Amid a period of above average returns. the market loss of -4.6% in the first quarter may not seem like such a bad loss.
But past performance is a not a guarantee of future results, and there is a risk the pattern of intermittent losses shown here will not be repeated.
That risk is precisely why the stock market has rewarded investors with much greater returns than risk-free government backed Treasury Bills for many decades!
Click image to enlarge
With the 12-month inflation rate at its worst in 40 years, the Federal Reserve hiking interest rates, Russian dictator Valdimir Putin threatening the American-built geopolitical balance in place since World War Two, investing in stocks may seem riskier than normal but keep things in proper perspective:
The U.S. stock market is always risky and unpredictable and that’s why it’s been such a profitable long-term investment for nearly a century; stocks represent just one investment in a diversified portfolio, key fundamentals driving economic growth are strong, and since the March 23, 2020 bear market low, the S&P 500, America’s largest publicly investable companies, is up 68%!
Stocks, as measured by the Standard & Poor’s 500, in the 20 years ended March 31, 2022, averaged a +9.3% annual return, nearly seven times the +1.2% annual return on the risk-free 90-day U.S Treasury Bill. Backed by the full faith and credit of the U.S. Government, T-Bills are considered a riskless investment, while the value of stocks is subject to ups and downs and, in theory, your entire investment could be lost in stocks.
Subtracting the return on T Bills from the return on stocks, the resulting 8.1% is the premium paid for taking the risk of owning U.S. stocks over the 20-years. To be clear, investing in America’s 500 largest publicly-held companies earned an average of 8.1% more annually than a risk-free investment in the past 20 years.
This 20-year period encompassed three frightening bear markets — the tech crash of 2002, the financial crisis of 2008, and the Covid downturn of early 2020.
Past performance is no guarantee of your future results and that, paradoxically, is precisely why investors are paid a premium for owning stocks.
Yes, stocks are risky and past performance is no guarantee of your future results! That is precisely why stocks have returned 8.3% more annually than U.S.-Government-guaranteed investments through three bear markets and financial crises of the past 20 years.
Click image to enlarge
As one might expect, the riskier stocks were hardest hit by the stock market pullback. Small-cap growth stocks declined in value by -9.5%.
Large-company stocks that are less dependent on growth declined the least, with the S&P 500 value stock index falling a scant two-tenth of 1% last quarter.
Click image to enlarge
Energy company stocks soared in value by 39%! Rising oil prices fatten profits. American energy companies could benefit from a European ban on Russian natural gas and oil. However, it takes months for U.S. energy companies to ramp up oil production and exports of natural gas.
Click image to enlarge
If you thought the U.S. stock market was hard hit by the continued disruptions caused by the pandemic, Chinese equities dropped more than three times as much.
China’s policy of zero-Covid tolerance has resulted in lockdowns for weeks in its largest cities, adding to manufacturing delays affecting consumers worldwide. Europe’s stock market index suffered on worries about the impact of banning imports or Russian oil. Germany, by far Europe’s largest economy, is heavily dependent on Russian oil.
Click image to enlarge
Of 13 distinctly different asset classes represented here by stock indexes, oil was No. 1 in the first quarter of 2022, with oil prices rising as Russia’s pariah status spread across the globe. Meanwhile, the world’s No. 2 exporter of grain behind the U.S., Ukraine, unexpectedly had to shut down its agriculture business to fight an existential battle for its statehood, which sent prices of agricultural commodities higher.
Fixed income investments lost -6.5% in the quarter and rising rates sent bond prices lower.
Click image to enlarge
Here’s a good way of looking at the first quarter loss of -4.6% on the S&P 500 stock index in an historical context.
The 10-plus year expansion that erupted after the global financial crisis of 2008 was a period of spectacular annual gains.
Then came 2021, when the Standard & Poor’s 500 stock index, with dividends reinvested, returned an astonishing 26.9%!
That was the third consecutive year of extraordinary gains for the stock market, especially when you consider 2020 was marred by the pandemic.
Keep in mind, the calendar-year returns don’t show the 33.9% drop in stocks in February and March 2020.
Click image to enlarge
Despite the first quarter loss of -4.6%, the S&P 500 stock index was up +15.7% in the 12 months ended March 31, 2022.
Click image to enlarge
In the 12 months ended March 31, 2022, stocks continued to beat bonds. Energy and commodities companies, which go in and out of fashion unexpectedly depending on supply disruptions and the economic cycle, beat stocks handily.
U.S. stocks bested foreign bourses in the 12-months, and large-cap growth stocks again led U.S. stocks when looked at based on market-capitalization and their growth versus value characteristics.
Click image to enlarge
After trading sideways for in 2015 and most of 2016, the stock market broke out after the November 2016 election. It rose steadily to new peak on September 20, 2018, and then nosedived -20% at the end of 2018 after the Federal Reserve hiked rates, which raised fears that an inverted yield curve was imminent. It was a Fed policy mistake, that was acknowledged by the Fed chief.
On January 4, 2019, the Fed signaled rates were on hold,. Stocks rallied for most of the remainder of 2019.
Stocks rallied and next peaked In February 2020. Then the COVID-19 virus threw the economy and stock market into a meltdown.
Government action to add liquidity to the economy through aid payments brought about a swift turnaround that began in late March.
By early September 2020, following the enactment of the CARES Act and related legislation, stocks hit a record all-time high.
After a pause, stocks rallied steadily from the November 2020 election through year-end.
The S&P 500 continued upward through the first quarter of 2021.
The March 2021 enactment of the $1.9 trillion American Rescue Plan Act extended the rally, which continued through the end of 2021 despite the Omicron COVID variant.
Stocks turned down in the first quarter of 2022 on Fed tightening and Russia’s invasion of Ukraine.
However, over the five years ended March 31, 2022, the S&P 500 total return index, including dividends, gained +110%.
Click image to enlarge
Click image to enlarge
Click image to enlarge
Click image to enlarge
Click image to enlarge
Russia is challenging world order, inflation is at a 40-year high, and a stock market correction has been underway. The relentless progress of the United States is being tested once again. Here’s an important perspective on this moment in financial history.
On March 23, 2020, the stock market bottomed. The Covid bear market had erased -33.9% of the value of the Standard & Poor’s 500.
In that moment, which preceded the advent of vaccines, no one knew the bear market was over. No one knew the stock market would appreciate by 71% in the next 21 months. In the throes of the Covid crisis, no one expected the U.S. government would embark on the largest transfer payments programs since The New Deal.
In that fraught time, no one predicted that the American consumer’s balance sheet, two years hence, would be stronger than ever in modern American history. Nor did anyone foresee that the Covid-19 would be managed much like the flu.
The difficulties are likely to hinder stock returns in the months ahead, which is why we have done our best in this presentation to help you look beyond this bleak moment in history.
Click image to enlarge
4Q 2021

Click image to enlarge
Economic growth drives corporate earnings, and earnings drive stock prices.
So, before reviewing the performance of stocks and other classes, it’s best to start with a quick look at the latest economic data.
This data was released shortly after the end of the fourth quarter and reflects what was happening in the real economy.
Housing starts unexpectedly rose sharply in December, according to the Census Bureau.
With 1.7 million housing starts in December, growth in homebuilding has not been this strong since early 2007. In addition, 1.87 million housing permits were issued in December, an indicator that housing starts will continue to be strong in the weeks ahead.
The U.S. requires about 1.6 million new homes to be constructed annually to keep up with population growth.
To be clear, housing growth is more robust than it has been in many years.
Housing is an important fundamental because it touches so many parts of the economy, including retail sales of what we buy at Home Depot and Amazon, as well as construction materials and labor.

Click image to enlarge
Meanwhile, the newest forecast for the growth of the economy in 2022 also came in strong.
The newly released consensus forecast of 60 leading economists polled quarterly by The Wall Street Journal for the five quarters ending December 31, 2022, calls for very strong growth in 2022.
The growth in gross domestic product for the fourth quarter of 2021, which will be reported at the end of January, is expected to come in at 5.8%.
The economists expect a growth rate for each of the following four quarters of 2022 of slightly more than 3%.
That’s much higher than the 2.2% long-term U.S. growth rate expected by the non-partisan Congressional Budget Office.

Click image to enlarge
The U.S. Index of Leading Economic Indicators, a forward-looking measure, rose +0.8% in December.
It has soared for months since April 2020, when the recovery from the pandemic began.
The significance of the LEI is that it has historically rolled over before every recession in modern U.S. history, except for the COVID-19 recession.
Nothing like that is happening now, as the index is reaching new heights and economic signals point to above-average growth in the months ahead.
The forecast for growth from the economics team at The Conference Board, a big-business association that collects data monthly on the 10 component indexes of the LEI, is for a +3.5% growth rate in 2022!

Click image to enlarge
In 2021, the Standard & Poor’s 500 stock index, with dividends reinvested, returned an astonishing 26.9%!
It was the third year of extraordinary gains for the stock market, and the second marred by the pandemic.
The calendar-year returns on stocks since the end of the Great Recession in March 2009 have been spectacular.
Keep in mind, the calendar-year returns don’t show the 33.9% drop in stocks in February and March 2020.
Interest rates are at their lowest point in U.S. history. Federal Reserve policy on inflation recently changed, and it is causing new financial fears. Tax policy is in the throes of major changes affecting high-income and high-net-worth Americans.
Who could have predicted it?
Who could have predicted that, despite the second year of a pandemic, stocks would soar for a third straight year and rack up nearly three times their annual average return?
Not Wall Street’s best minds!

Click image to enlarge
2021 marked another year in which Wall Street’s biggest firms and their best strategists failed to predict the stock market.
On December 21, 2020, Barron’s published an article in which the venerable financial magazine asked 10 leading Wall Street strategists to predict the closing price of the S&P 500 on December 31, 2021.

Click image to enlarge
The S&P 500 closed 2020 at 3756, and the mean forecast of the 10 strategists was for the S&P 500 to close 2021 at 4040, which would amount to about an 8% gain.
The strategists’ consensus was not even close to the 26.9% gain for 2021.
In this chart, compiled by independent economist Fritz Meyer, each black line represents the consensus forecast of the 10 strategists published in Barron’s every December since 2008.

Click image to enlarge
If Wall Street strategists’ forecasts had been correct, the dots would all fall right on the red line representing the S&P 500, but their predictions were often way out of line with what occurred in the market!
Although Wall Street strategists’ forecasts have been consistently unreliable since 2008, their predictions for 2021 were so far off!
Which should serve as a reminder of how the largest brokerages, with help from the financial press, can steer investors in a bad direction.
It’s reason No. 9 to trust our advice: We are independent of the Wall Street sales machine.

Click image to enlarge
Stocks posted an +11.0% gain in the fourth quarter of 2021, following a +0.6% gain in the third quarter of 2021.

Click image to enlarge
The stock market since 1926 has averaged slightly more than a +10% annualreturn, averaging a return of about +2.5% per quarter.
In 2021, the average quarterly return was +6.6%—more than twice the average quarterly return of +2.5%.
This table shows the returns in each of the last 28 quarterly periods, seven years.
In the past 28 quarters, the return on stocks was +2.5% or more 19 times. The average quarterly return was less than 2.5% in nine of the past 27 quarters.
To be clear, two-thirds of the past 28 calendar quarters showed above-average returns.
Keep in mind, this period includes a double-digit correction in the fourth quarter of 2018 and the COVID bear market plunge in the first quarter of 2020.

Click image to enlarge
Large-cap growth stocks led the market, as shown in this chart.
It was the third quarter in a row in which large-company growth stocks led the six categories of U.S. equities.
Small-cap value stocks led the two previous quarters.

Click image to enlarge
Nine of the 10 industry sectors in the Standard & Poor’s 500 stock index showed a positive return in the three months ended December 31, 2021. Communications services was flat for the quarter.

Click image to enlarge
The U.S. led foreign regional stock market indexes in the three months ended December 31, 2021, with Europe gaining about half as much as the U.S. and a slowdown in China’s economic growth depressing stocks in emerging markets and Asia Pacific as well as China.

Click image to enlarge
Of this broad array of 13 asset classes represented by securities indexes, only real estate related indexes topped the strong return on the S&P 500 stock index for the three-month period ended December 31, 2021.

Click image to enlarge
With dividends reinvested, the total return in 2021 was an astounding +28.7%.

Click image to enlarge
The hot economy in 2021—fueled by government aid during the pandemic and the lowest interest rates in U.S. history—drove stocks higher for much of the year. Economic expansions make growth companies grow even faster, which is why the S&P 500 growth stock index returned 32% in 2021 versus the 24.9% total return of the S&P 500 value stock index.
Keep in mind, the average annual return on U.S. stocks since 1926 is 10%. Also keep in mind that stocks are only one asset class in a diversified portfolio. Stocks are indeed the most important asset class in most portfolios because they are publicly traded. Unlike real estate, partnerships, hedge funds, and other direct investments, you can sell all your stocks on any normal business day. Making the comparison between S&P 500 performance and your portfolio return is apples and oranges.

Click image to enlarge
A rebound in oil and gas prices fueled a +54.6% total return in the Standard & Poor’s Energy stock index.
Predicting next year’s one-year leading sector is pretty much impossible to do with much reliability.
Here’s why.

Click image to enlarge
The 12-month industry sector returns for the nine past quarters shown here illustrate why it is so difficult to predict markets.
Starting from the lower right, for the 12-month period ended December 31, 2019, the worst-performing stock sector was energy. Energy stocks were laggards for five quarters and racked up tremendous losses for four consecutive quarters. For the last two quarters, however, energy was the top-performing stock sector in a roaring bull-market surge.
With stocks breaking all-time highs month after month, greed and fear—two strong emotions—are likely to make appearances on financial cable TV talking heads, in newspaper reports, and, perhaps most insidiously, on social network ad campaigns.
This is important evidence of how unpredictable the future of markets is. Going through this bit of history may help you stay focused on a strategic investment plan.
The 12-month returns on the 11 industry sectors that comprise the S&P 500—America’s most valuable 500 publicly investable companies—for these six quarters tell a story about how unpredictable stock market investing can be.
Similarly, financials have been among the top sectors for the last three quarters, with a +35% total return in the fourth quarter of 2021, a +59.2% return in the third quarter of 2021, and a +62% return for the 12 months ended June 30, 2021. But—and this is a big “but”—financial company equities had lost money in four of the 12-month quarterly periods preceding the second quarter of 2021!
Point is, after suffering 12-month losses in four consecutive quarters, could anyone have predicted financials would be a consistent top performer?
If anyone could do that, would they need to manage your money?
Instead of chasing dreams, please consider the strategy we use—modern portfolio theory—as a framework for portfolio management.

Click image to enlarge
For the 12 months ended December 31, 2021, the U.S. led foreign regional stock market indexes with +28.7%. European stocks, as measured by the S&P Europe Broad Market Index, gained +16.3%. A slowdown in China’s economic growth depressed stocks in emerging markets and Asia Pacific as well as in China.

Click image to enlarge
In 2020, oil was the worst of the 13 asset classes represented by indexes in this chart. It suffered a -60.4% loss! The pandemic squelched demand for oil.
In 2021, that changed dramatically. The world economy began returning to normal, and demand rose much faster than the supply of oil.
Capital gain producing assets, such as real estate and growth stocks, which tend to rise in value in periods of economic expansion, showed strong appreciation.
Bonds in 2021 suffered a loss of -3.2% as easy monetary policies of the Federal Reserve continued and rates remained at their lowest levels in U.S. history. With the Fed expected to begin raising rates, and inflation looming larger, the outlook for bonds worsened.

Click image to enlarge
After trading sideways for approximately two years in 2015 and most of 2016—and hitting two air pockets along the way—the stock market broke out after the November 2016 election. It rose steadily to an all-time peak on September 20, 2018, and then nosedived by -20% on fears that an inverted yield curve was imminent.
On January 4, 2019, the Fed signaled rates were on hold, whereupon stocks rallied for most of the remainder of 2019. Stocks rallied and hit a new all-time peak In February 2020. Then the COVID-19 virus threw the economy and stock market into a meltdown. Government action to add liquidity to the economy through aid payments brought about a swift turnaround that began in late March. By early September 2020, following the enactment of the CARES Act and related legislation, stocks hit a record all-time high.
After a pause, stocks rallied steadily from the November 2020 election through year-end. The S&P 500 continued upward through the first quarter of 2021. The March 2021 enactment of the $1.9 trillion American Rescue Plan Act extended the rally, which continued through the end of 2021 despite the Omicron COVID variant.
Over the last five years, including dividends, the S&P 500 total return index has gained +133%.

Click image to enlarge
Large-cap growth stocks nearly tripled in value during the five years ended December 31, 2021.
Trillions of federal government aid payments in the form of checks to individuals and businesses, as well as increases in unemployment insurance checks, kept consumer spending strong, elevated savings accounts, and created a flood of demand for buying goods.
With the lowest rates in U.S. history and negative after-inflation bond yields, the outlook for stocks was more attractive. As a result, investors bid up stock price values.

Click image to enlarge
Technology stocks benefited the most from the pandemic-stricken economy over the five years ended December 31, 2021.
Stocks like Facebook, Amazon, Apple, Netflix, and Google gained by far the most from the stay-at-home COVID economy.

Click image to enlarge
In the five years ended December 31, 2021, though the world was ravaged by the COVID pandemic, the Standard & Poor’s 500 stock index, including reinvestment of dividends, showed a total return of +133.4%.

Click image to enlarge
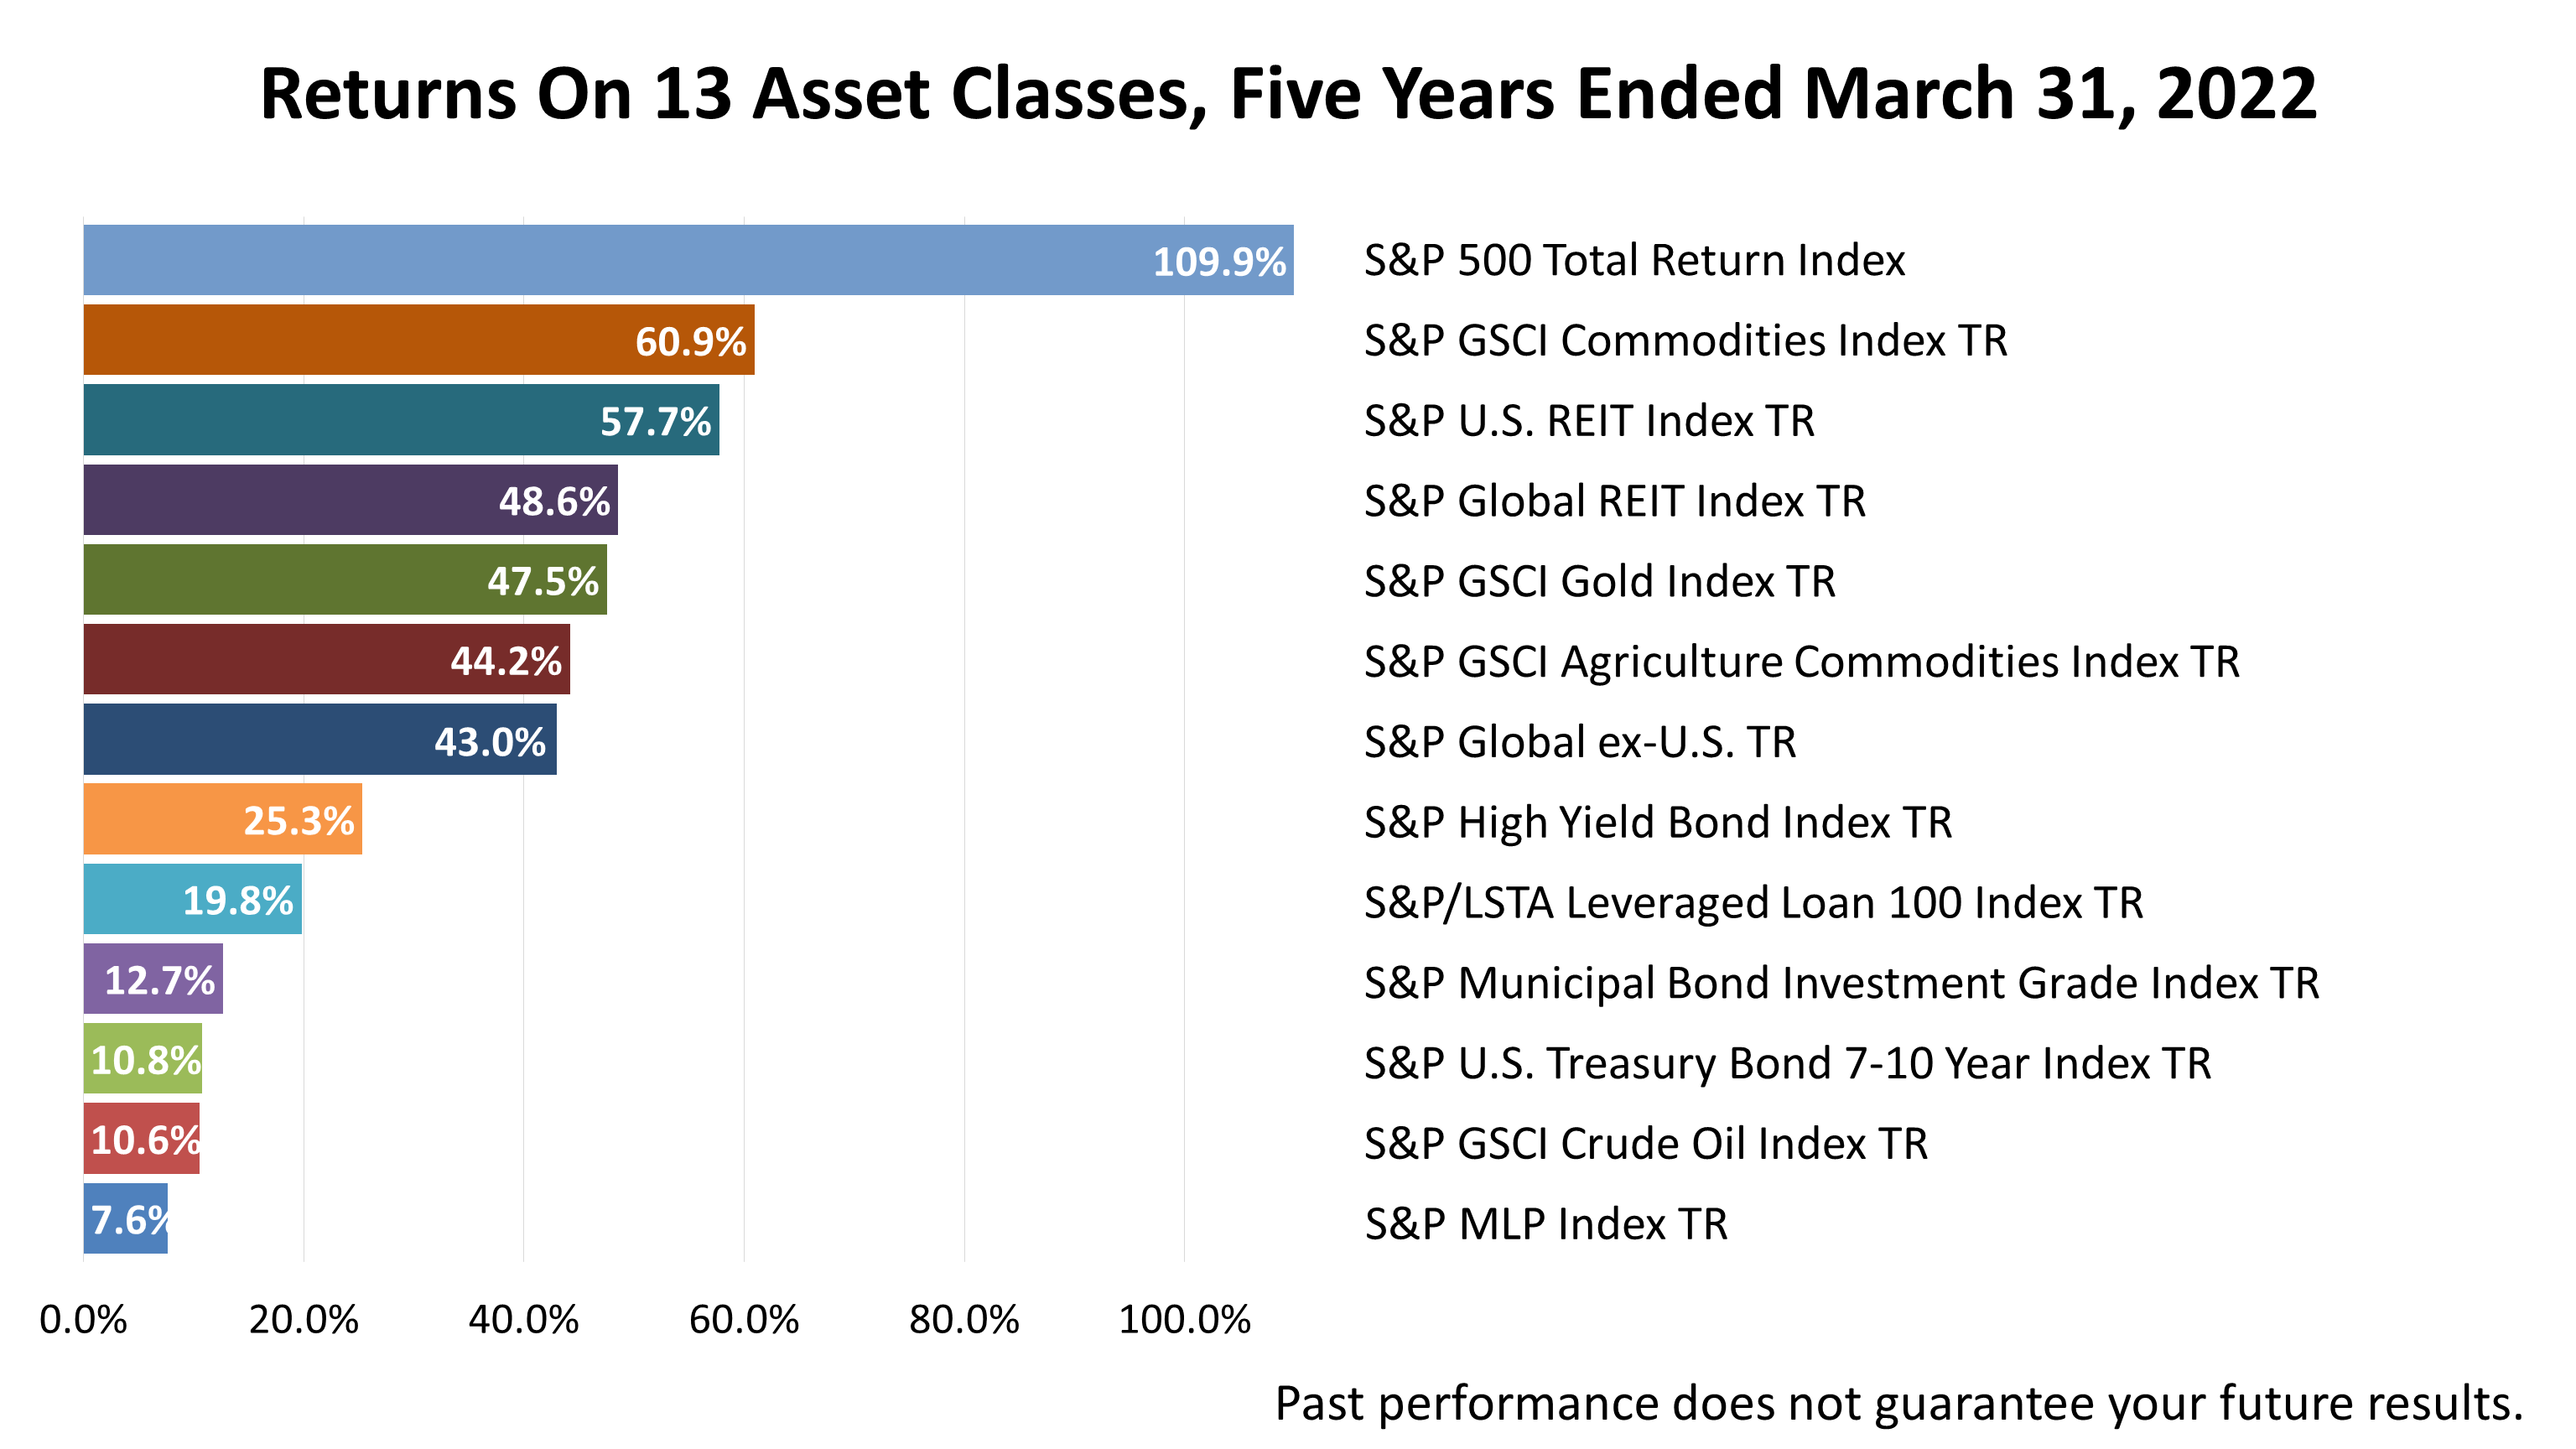
Of the 13 asset classes represented by indexes in this chart, oil was the biggest loser.
Despite a rebound in 2021, oil investments over the five years lost -28.6%.
Master limited partnerships, which are heavily weighted in the energy sector, was second-worst, with a -7.4% loss in value over the five years.
But the main takeaway from this chart is the outstanding performance of the broad stock market.
The S&P 500 Total Return was more than double the return of the No. 2 performing asset of this diverse group of securities indexes.

Click image to enlarge
With the stock market offering such strong returns over the last two years, a change in sentiment could cause a correction.
A drop in stock prices of 10%, or even more, could occur anytime.
That’s always true of the stock market.
That’s why stocks are risky. Investors put their money at risk because stocks throughout history have paid a premium over a risk-free asset.
So, investors should always be braced for a drop in stocks of 10% or more.
But—and this is a big “but”—there is no evidence that a recession is on the way and, thus, the chance of a bear market stock market drop of 20%, or like the 33.9% plunge when COVID hit and sent stocks tumbling from February 5 through March 23, 2020.
While risk and uncertainty are always possible, economic data has been stronger than expected for many months, and consumers are in the best shape in years.
Even though stocks could correct, better-than-expected profit growth could propel stocks higher still in 2022.
So, don’t be distracted by near-term uncertainty, and try to stay focused on what’s beyond the next crisis, drop, or surge.

Click image to enlarge
3Q 2021

Click image to enlarge
Modern portfolio theory, or MPT, is a framework for investing.
It provides the intellectual underpinning of our firm’s approach to investing.
Just as constructing the framework for a home is strategically designed by connecting one piece of wood with another, MPT provides a system for constructing a portfolio based on measurable dimensions of investments—history and quantitative characteristics.
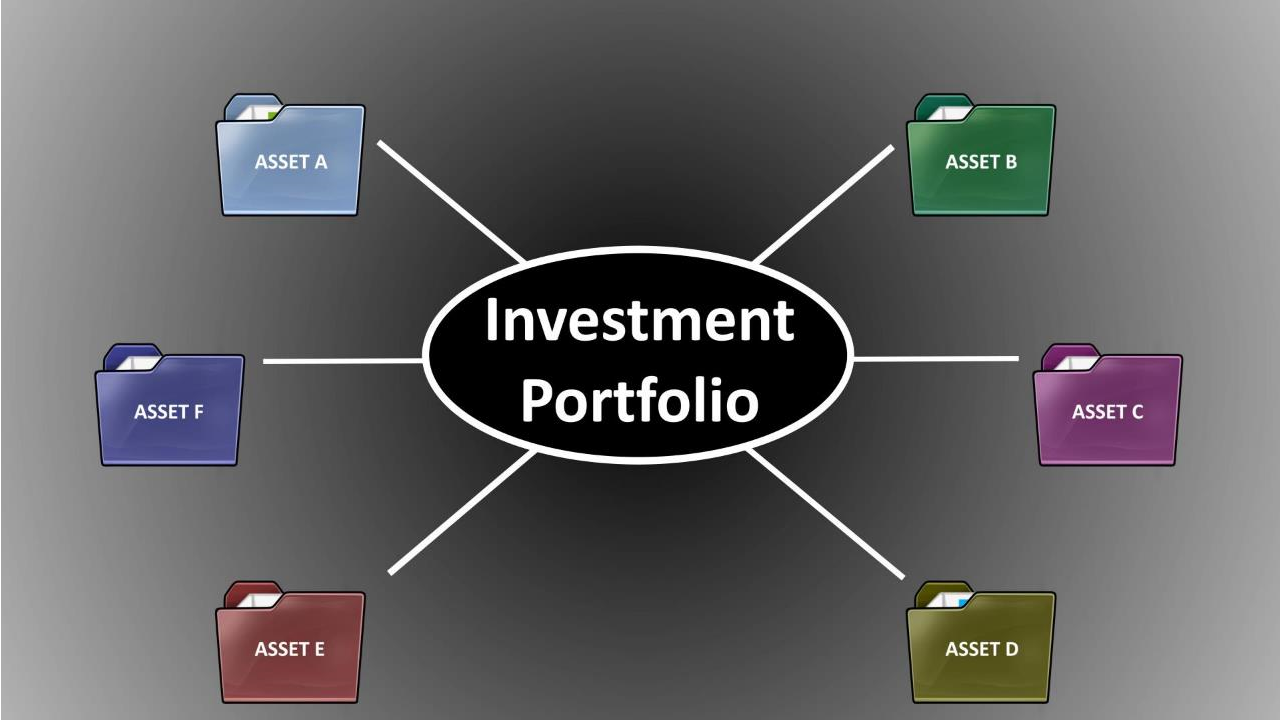
Owning different kinds of investments is less risky than owning only one type of asset, and MPT is a system for diversifying across a wide range of assets based on their statistical characteristics.

Click image to enlarge
Classifying investments based on their distinct characteristics—such as the aggregate value of a company’s shares outstanding, profit growth, and share-price variance—imposes a quantitative discipline for selecting combinations of investments based on historical data.
Investments revolve around a world that is always changing, and not enough statistical history of different kinds of investments exists to make investment predictions about the future with certainty.
MPT is a way of managing that uncertainty.

Click image to enlarge
Just as every stud or joist in a home has its own mathematical dimensions, investments have their own unique shapes and characteristics.
MPT organizes statistics that measure the characteristics of different kinds of investments to construct a portfolio.
MPT is a way of building a portfolio of investments so that the return you can expect over the long run is maximized for a given level of risk.
Just as a home can be built to your personal needs and preferences, so, too, can a portfolio be custom-built to suit your personal risk tolerance specifications.
To be clear, cookie-cutter portfolios are not what we do. Each portfolio can be tailored to an investor’s preferences.

Click image to enlarge
Economist Harry Markowitz introduced MPT in a 1952 essay.
He was awarded a Nobel Memorial Prize in Economic Sciences in 1990.
It’s worth noting that it took from 1952 to 1990, 38 years, for Markowitz to be recognized by the Nobel committee.
This provides insight into how long it takes for knowledge to be accepted.
Over the last 70 years, the power of modern portfolio theory has grown to be understood.
It is now the framework for investing embraced by institutional investors worldwide, and it is a foundational element in the curricula of the world’s best colleges and universities.
MPT does not guarantee investment success—nothing does—but MPT is embraced by pension funds and other institutional investors, and it is the intellectual underpinning for the performance numbers we’ll share with you in this report.

Click image to enlarge
MPT is a starting point for constructing a quantitatively driven portfolio based on fundamental economics.
MPT enables a financial professional with an understanding of the math to adjust what’s happened in the past to devise an investment plan based on economic fundamentals.
Just as the laws of physics are relied upon for building a home, fundamental factors of economics are relied upon in constructing a portfolio.
For example, we know that 70% of the American economy is accounted for by consumer spending.
To measure strength in the economy, monthly data published by the U.S. Government—such as the savings rate, compensation of employees, personal income, and inflation—provide decades of data about trends.
The growth of the economy drives investment returns.

Click image to enlarge
Perhaps the most direct way of connecting the dots between economics and investing is this chart illustrating that what drives stock prices is earnings.
Plain and simple, corporate profits—that is, earnings—drive stock prices.
The gray dotted line shows the +7.5% long-term earnings growth trend since 1991.
In 2020, actual earnings of the S&P 500 companies were $139.76 per share.
Expected earnings in 2021, according to Wall Street analysts’ estimates compiled by Institutional Brokers’ Estimate System (IBES), are $200.64 per share and are expected to shoot up to $219.94 for 2022.
The red arrows drawn in here literally connect the dots to make the forecast clear: The next 20 months’ corporate earnings are expected to rocket much higher.

Click image to enlarge
In this chart, to show how earnings drive stock prices, we added the S&P 500 Total Return index, in the black line.
This shows the nearly perfect correlation between stock prices and underlying earnings. The 2021 and 2022 earnings forecasts, in the red dots, pull the black line higher.

Click image to enlarge
For the quarter, the S&P 500 eked out a gain of six-tenths of 1%. Although the gain was fractional, it was the sixth consecutive quarter in which the S&P 500 showed a positive return since the -19.6% quarterly loss in the first quarter of 2020, when the COVID pandemic struck the U.S.
Between the March 23, 2020 bear market low and the end of the third quarter of 2021 on September 30, 2021—18 months plus one week—the S&P 500 total return, including reinvestment of dividends as well as price appreciation, was more than 60%.
It’s an astonishing recovery!

Click image to enlarge
The stock market since 1926 has averaged slightly more than a +10% annualreturn, averaging a return of about +2.5% per quarter.
This table shows the returns in each of the last 27 quarterly periods, one quarter shy of seven years.
In the past 27 quarters, the return on stocks was +2.5% or more 18 times. The average quarterly return was less than 2.5% in nine of the past 27 quarters.
To be clear, two-thirds of the past 27 calendar quarters showed above-average returns.
Keep in mind, this includes a double-digit correction in the fourth quarter of 2018 and the COVID bear market plunge in the first quarter of 2020.

Click image to enlarge
This bar chart highlights how diversification works.
By divvying up U.S. companies into these six categories based on their characteristics and statistical history, you can see the difference in returns even over a three-month period.
When these differences in returns recur for a few quarters, which can happen from time to time, rebalancing the portfolio to restore it to your preferred risk profile is required.

Click image to enlarge
There are many reasons why professional advice may be best for managing your financial situation. Here’s a good one.
One of the services our firm offers is portfolio rebalancing. Periodic rebalancing is about as important to investor success as personal advice on tax efficiency. Rebalancing your portfolio is not a sexy-sounding benefit of working with a professional, but it might affect your portfolio’s terminal value about as much as tax-smart investing advice, which is another important reason to hire an investment professional.
Automated calculators for rebalancing get the math right, but getting investors to use them to rebalance once a year requires a commitment of time and an interest in personal finance, as well as behavioral change. Working with a qualified professional who knows your financial goals and risk tolerance comes in handy in the period since COVID hit the U.S.
Since the pandemic hit in the first quarter of 2020, technology was the No. 1 performer of 11 S&P 500 industry sectors for five consecutive quarters, but for the last two quarters was a middling performer.
The 12-month returns for the past six quarters on stocks classified by industry sectors illustrate why a portfolio rebalanced once a year by a professional is so important to investor success.
During the pandemic, both the Standard & Poor’s tech sector and the overall index were big winners because shopping online was safer health-wise. So was watching Netflix. And Google ads suddenly were attracting more eyeballs. Apple and Microsoft earnings growth was four times the earnings growth on the average S&P 500 stock, according to Fritz Meyer, an independent economist. It was totally unexpected, of course.
The tech sector was the only one of the 11 industry sectors that make up the S&P 500 index to show a gain (10%) in the first quarter of 2020, when COVID hit. It was just the start. For the next three quarters, tech sector 12-month returns for stocks came in at an astonishing +37%, +47%, and +44%. It was an historic bull market kicked off by government transfer payments to consumers, and it is still in progress. But tech stocks for the past two quarters have not been dominating. They’ve now returned to the middle of the pack of the 12-month 11-sector index performance.
Successive quarters of outperformance would have allowed your tech stock position to grow unchecked and dominate in your portfolio results. With leadership shifting, a rebalanced portfolio would have been better able to benefit from the change in leadership in the past two quarters.
There are many ways to rebalance a portfolio. Rebalancing based on a portfolio’s industry sector weightings is shown for illustration purposes.

Click image to enlarge
Here is the three-month performance of the S&P 500 stocks through September 30, 2021. Industrials, materials, and consumer stocks took a hit as the Delta variant caused supply chain disruptions. Financials benefited as the yield curve widened, which enabled financial companies to make more money on the spread between long- and short-term interest rates.

Click image to enlarge
While the quarter started off looking quite bright, performance of U.S. companies was hampered throughout the summer by the spread of the Delta variant.
Meanwhile, in China, a government crackdown on huge tech companies, like Alibaba Group, caused a drop in China’s fledgling stock market.

Click image to enlarge
As the world recovered from the pandemic, demand for commodities and oil rose sharply while supply chain disruption sent prices higher. The S&P 500, which has often been atop this three-month chart in recent quarters, fell to the middle of the pack as the Delta variant threatened the strength of the pandemic recovery.

Click image to enlarge
Stocks climbed a wall of worry during the 12 months ended September 30, 2021. The pandemic-plagued economy faced a long list of uncertainties, but the S&P 500 gained 30%.
Following massive unprecedented government transfer payments to prop up the economy during the COVID partial shutdown of the economy, Americans were sitting on an unprecedented amount of cash in checking and savings accounts.
The consumer economy, which accounts for 70% of U.S. gross domestic product growth, remained extremely strong, but a surge of inflation, supply-chain bottlenecks, and price-to-earnings ratios higher than the historical norm allowed a new round of doubts and fears to spread.

Click image to enlarge
At the upper left is the 12-month total return on U.S. stocks classified by their market capitalization and style. At the lower right is the same 12-month results one year ago.
The results one year ago were almost a mirror image for what occurred over the past 12 months.
Small-cap value stocks were the top category in the recent 12 months, with a +66.6% return, but this same category was last one year earlier, with a -16.9% loss.
The same was true of mid-cap value stocks, which were ranked second-worst among the six categories one-year ago but turned on the second-best return over the most recent 12 months.
This is why diversification and rebalancing works.

Click image to enlarge
Not to belabor the point, but you can see the same pattern in these two charts comparing returns on seven categories of foreign and domestic stock indexes.
In the most recent 12-month period, small-company U.S. stocks returned an astounding +57.6%. But just a year ago, the same chart showed small-caps were the worst performers, with a loss of -8.3% in the preceding 12 months.
Similarly, the Chinese stock market index was the No. 1 category, with a +33.2% return, one year ago. But in the more recent 12-month period, on the left, the Chinese stock market lost -4.7% in value.
Again, this highlights the wisdom of diversifying and rebalancing.

Click image to enlarge
Again, the one-year results of this basket of 13 different asset classes for the period ended September 30, 2021 is almost a mirror image of the same chart one year earlier.
Gold was the biggest losing asset in the most recent 12 months, but one year ago it was atop this list. The reversals in the returns of Treasury bonds, master limited partnerships, commodities, and REITs also highlights how unpredictable investing often can be, and underscores the need for a strategic approach based on diversification.

Click image to enlarge
Over the five years ended September 30, 2021, including dividends, the S&P 500 Total Return index gained an astonishing +118%.
The five-year gain average annual growth rate was nearly 24%! That’s more than double the stock market’s long-term annual total returns of approximately +10% going back 200 years, as described by Wharton Business School’s professor Jeremy Siegel in his seminal book, Stocks for the Long Run, first published in 1994.
Despite the COVID pandemic bear market plunge in February and March 2020, when stocks lost -33.9%, investments in stocks more than doubled in this five-year period which was fraught with uncertainty.
The performance of the five largest companies in the S&P 500—Apple, Microsoft, Amazon, Google and Facebook—has led the recovery in stocks since the pandemic low in the Standard & Poor’s on March 23rd, 2020.
And, because the major stock indexes are weighted by market capitalization, the super returns on just these tech giants powered the performance of the S&P 500.
However, their valuations are not out of control.

Click image to enlarge
With a $2.4 trillion market capitalization on Apple, and $2.2 trillion market cap on Microsoft, they are expected to grow their profits by +31% and +27%, respectively.
As a result, the super caps are trading at low price-earnings-growth—or PEG—ratios relative to the other 495 stocks in the S&P 500 Index.
A PEG ratio is a company’s price/earnings ratio divided by its expected earnings growth rate.
It adjusts the traditional price/earnings metric for valuing a company’s stock by accounting for its expected earnings growth rate.
The five super caps may appear expensive relative to the S&P 500’s average P/E ratio of 21.9, but their earnings growth rate is reflected in the PEG ratios, and they are cheap by this important metric relative to the other 495 companies in the index.
For example, the expected earnings growth rate for Amazon is +64%, and its PEG ratio is 1.0%, versus the S&P 500 average PEG ratio of 3.1.
Stocks are risky investments and they are volatile.
The S&P 500 suffered intraday declines of -2% this past summer, and one-day losses of more than 1%, but it repeatedly bounced back and hit new highs.
Uncertainty about the risk of the COVID-19 variant, as well as inflation, is likely to cause big drops in the S&P 500 in the days ahead.
Yet stocks are the growth engine of a retirement portfolio and a key in building a tax-smart investment plan with the objective of lasting the rest of your life.
This table entitled was derived from a class for financial professionals by Fritz Meyer, an independent financial economist, on Advisors4Advisors on October 13, 2021.

Click image to enlarge
The five super caps were the key factor that drove the five-year return on S&P 500 Growth stock index.
Doubling in a five-year period is a marker of an explosive bull market, which makes the large-cap growth stock index’s performance all the more astonishing.

Click image to enlarge
Looking at the major regional stock indexes from different regions across the world shows the dominant performance of the U.S. stock market.
A decade-long bull market was ended by the pandemic-inspired bear market in February 2020, but the U.S., which has led regional bourses for many years, recovered from the COVID outbreak faster, and these stock results are a testament to that resilience.

Click image to enlarge
The five super caps drove the astounding return on technology stocks.
Though energy stocks led the sector indexes over the 12 months ended September 30, 2021, energy has been a terrible industry sector over the five-year period shown in this chart.

Click image to enlarge

Click image to enlarge
2Q 2021
Click image to enlarge
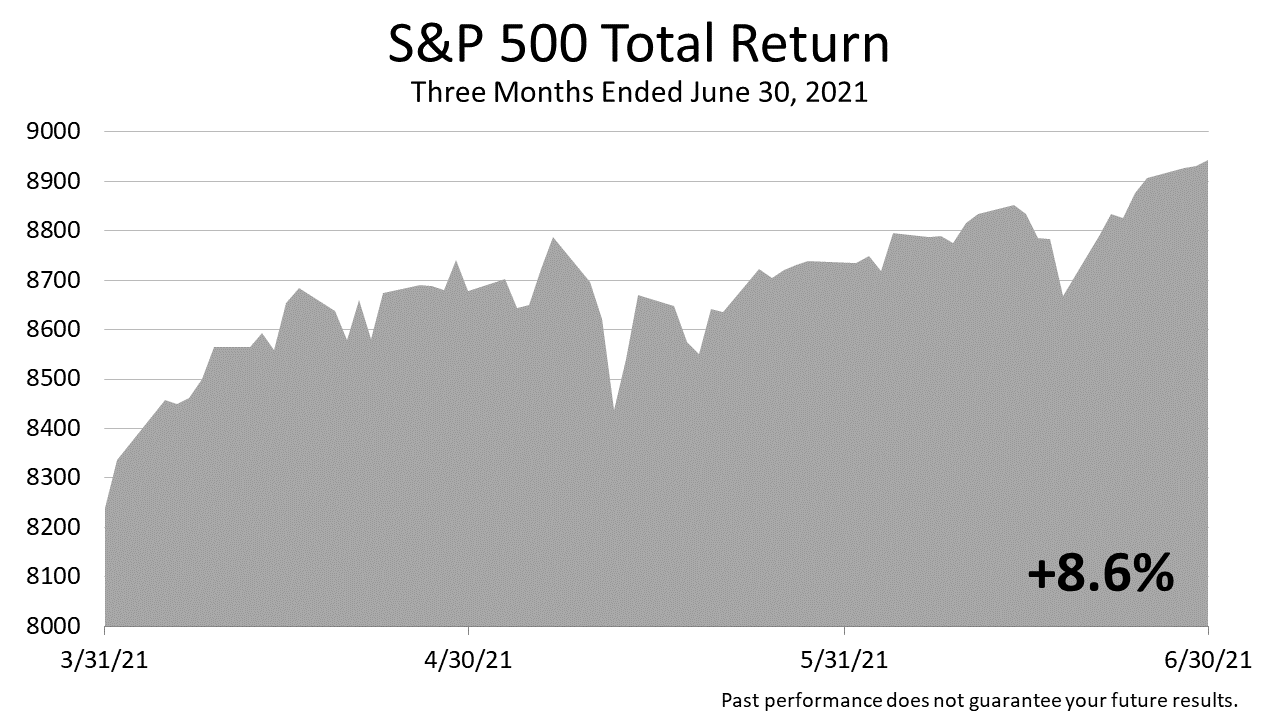
Stocks posted an +8.6% gain in the second quarter of 2021.
How good is an +8.6% return in a quarter?
Click image to enlarge
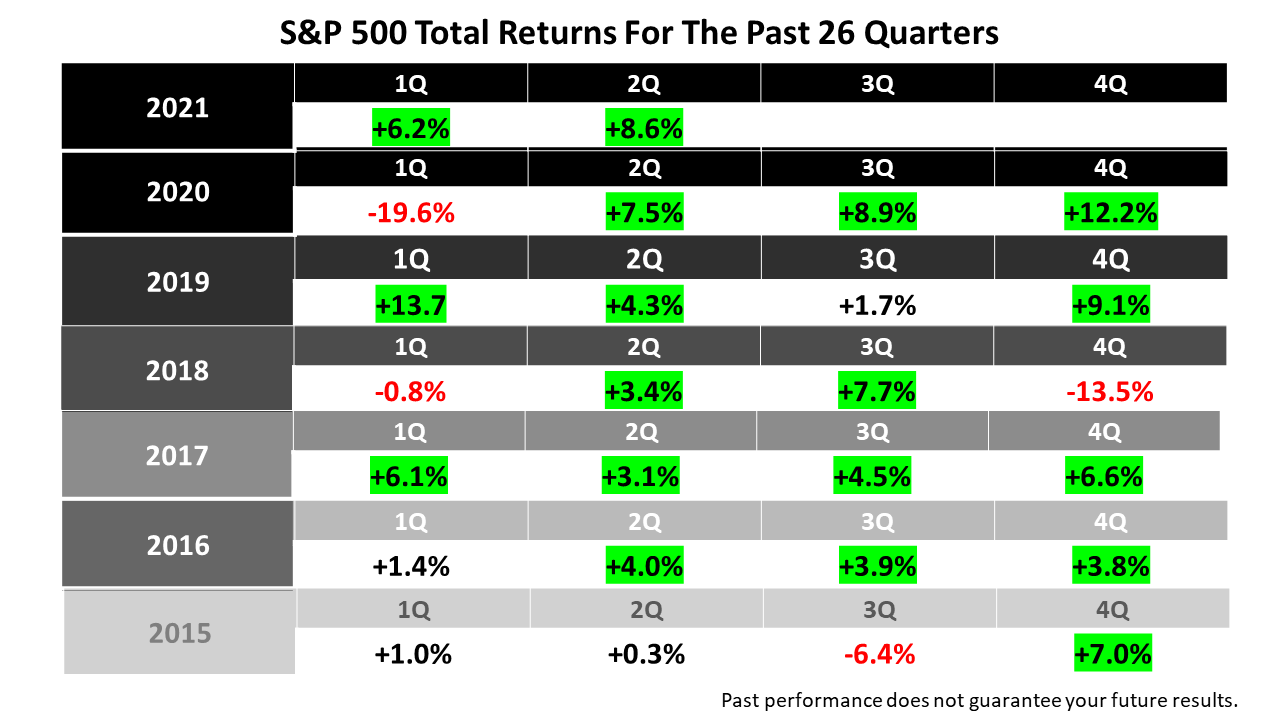
The stock market since 1926 has averaged little more than a +10% annual return, which would be about +2.5% a quarter.
This table shows the returns in each of the last 26 quarterly periods—six and one-half years.
The green-highlighted boxes indicate all the times in the past 26 quarters that the return on stocks was +2.5% or more.
In 18 of the last 26 quarters, the S&P 500 returned +2.5% or more, which is amazing since this includes a double-digit correction in the fourth quarter of 2018 and the Covid bear market plunge in the first quarter of 2020.
So, yes, an +8.6% quarterly return is very good, but we also want to remember that one quarter of data is not all that meaningful.

Click image to enlarge
This shows four different views of the quarterly performance of investments that matter most to our clients.
In the upper left, large-company growth stocks led the way among U.S. stocks as measured by the Standard & Poor’s 500 stock index, with a gain of +11.9%.
And the U.S. outperformed the other major stock markets across the world once again in the quarter.
In the lower right, you can see a diversified investor with a broad portfolio of 13 different asset classes. The picture was bright, with none of the 13 asset classes represented here showing a loss.
That is unusual.
But again, there are not many sweeping, grand conclusions to draw from just a single quarter of investment data.
Click image to enlarge
Let’s switch gears and look at a much longer time period and a more important metric for investors.
Stocks are risky. Everyone knows that. But let’s look at whether they have been worth the risk.
The stock market has been breaking record highs for nearly a year now, and stocks are high-priced by some traditional historical measures, such as trailing 12-month earnings.
With some pundits saying stock market risk is high, this is a good time to note how investors have been compensated for taking the extra risk of investing in stocks instead of parking cash in a so-called “riskless” asset like 90-day Treasury bills.
Click image to enlarge
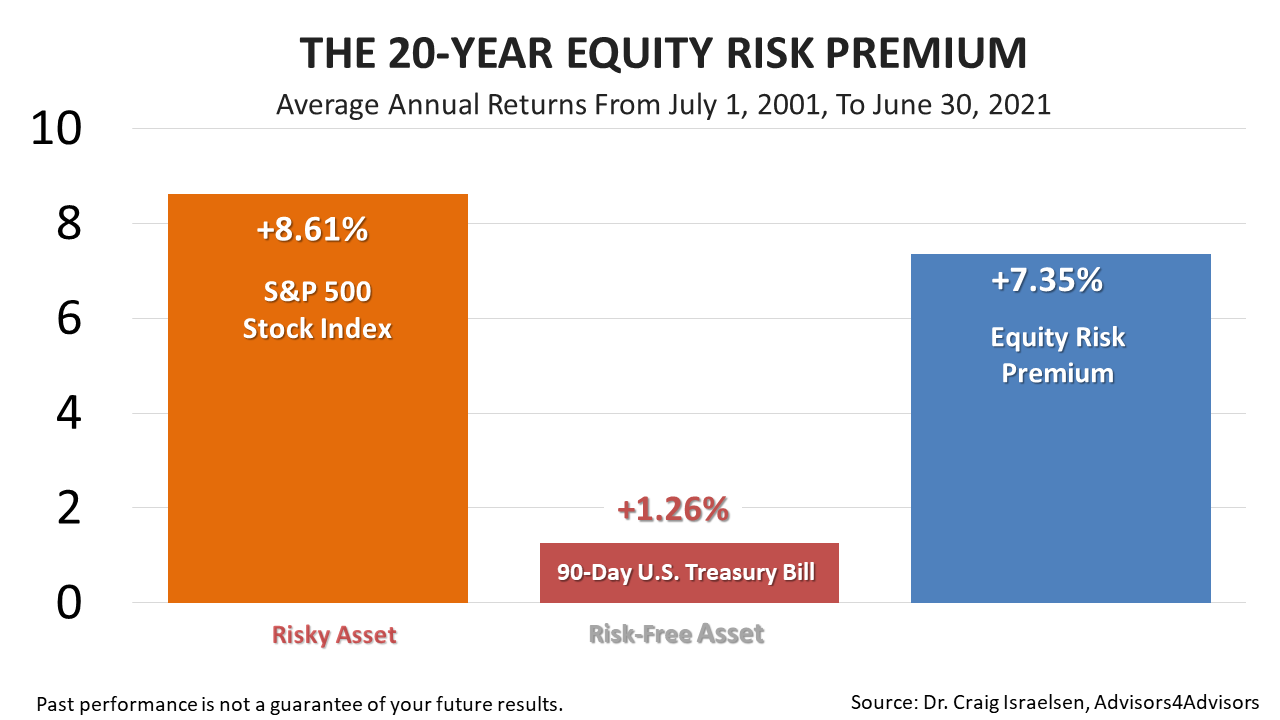
Stocks, as measured by the Standard & Poor’s 500 in the 20 years ended June 30th, 2021, averaged an +8.61% annual return, compared to the meager +1.26% annual return on a risk-free 90-day U.S. Treasury bill.
Since the T-bill is backed by the full faith and credit of the U.S. government, it is considered a riskless investment, while the value of stocks is subject to ups and downs and, in theory, your entire investment could be lost in stocks.
Subtracting the return on T-bills from the return on stocks, the resulting +7.35% is the premium paid for taking the risk of owning U.S. stocks over the 20-year period.
To be clear, investing in America’s 500 largest publicly held companies earned investors an average of +7.35% more annually than a risk-free investment.
This 20-year period encompassed three frightening bear markets—the tech stock crash of 2002, the financial crisis of 2008, and the Covid downturn of early 2020.
Past performance is no guarantee of your future results, and that, paradoxically, is precisely why investors are paid a premium for owning stocks.
The point is that, yes, stocks are risky, and that’s why they have had a higher return than guaranteed investments throughout history.

Click image to enlarge
If you had to describe the 12 months ended June 30, 2021, in one word, it would be “unprecedented.”
Everything about it was a first!
The first pandemic in a century.
The government’s $5.3 trillion in stimulus and direct payments was like nothing ever done before.
The vaccine development and distribution was like no national public health campaign before it.
The unprecedented low interest rates and low inflation rate, and an unprecedented policy by the Federal Reserve to leave rates alone despite signs of sharply higher inflation.
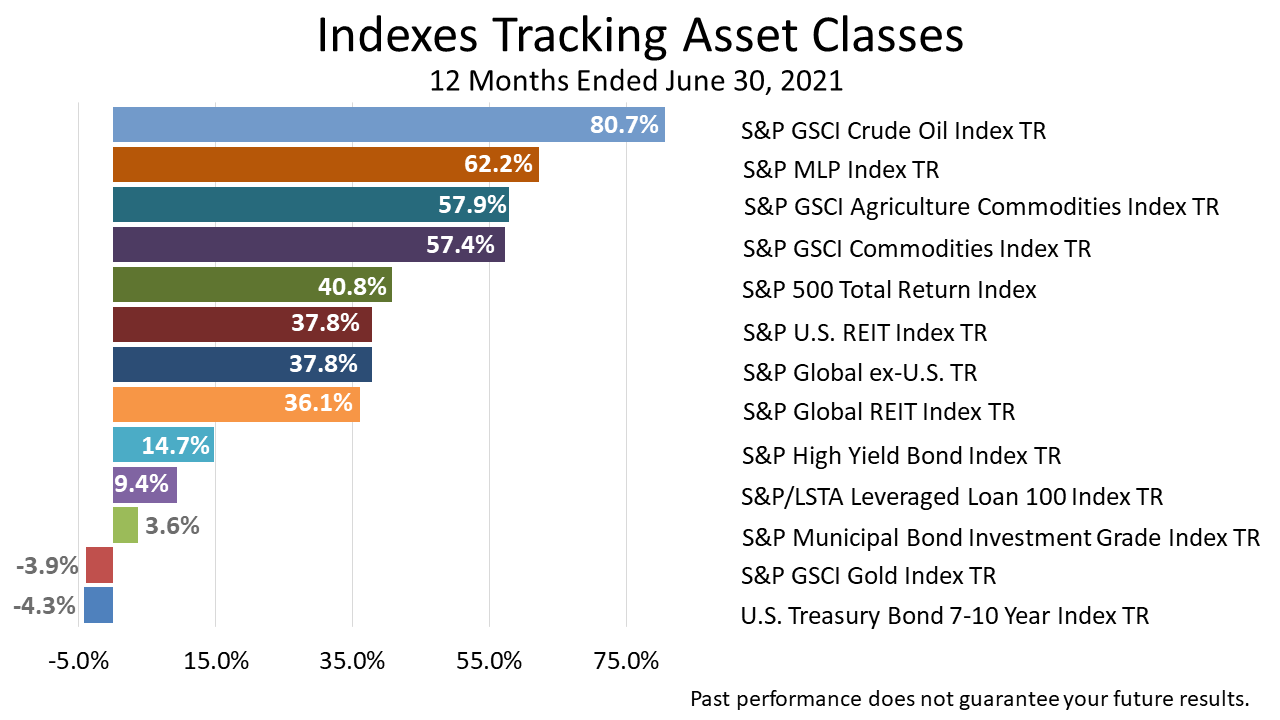
The 12-month gain was also a rare event: a +40.8% return!

Click image to enlarge
Categorized by market capitalization and characteristics, the best-performing types of U.S. stocks in the 12 months ended June 30, 2021, were small-company value shares, which returned nearly twice as much as the off-the-charts 12-month return on the S&P 500 of +40.8%.
The small- and medium-sized companies were playing catch up, having fallen the most in the pandemic.
Click image to enlarge
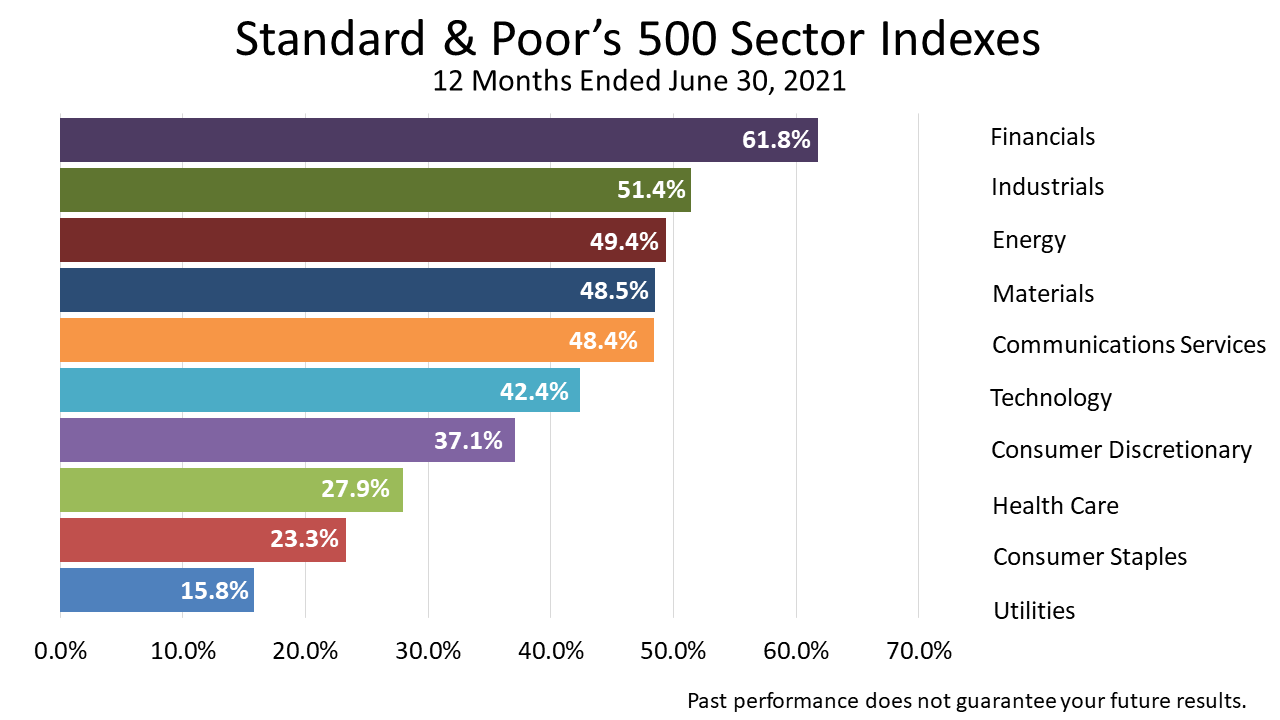
All 11 sectors of the S&P 500 were up in this one-year period ended June 30, 2021.
It was the second consecutive quarter in which all 11 industry sectors showed positive returns.
Despite the unprecedented risks, stocks across all 11 industry sectors delivered returns ranging from outstanding to breathtaking for 12 months.
The 11 S&P 500 industry sectors have averaged about a +10% return annually for decades.
In this most recent 12-month period, the poorest return of the 11 industry sectors was the +15.8% on the utilities stock sector index. That’s 50% more than a normal year!
Financials gained nearly +62% and was the top performing sector.
Was that predictable?
Click image to enlarge
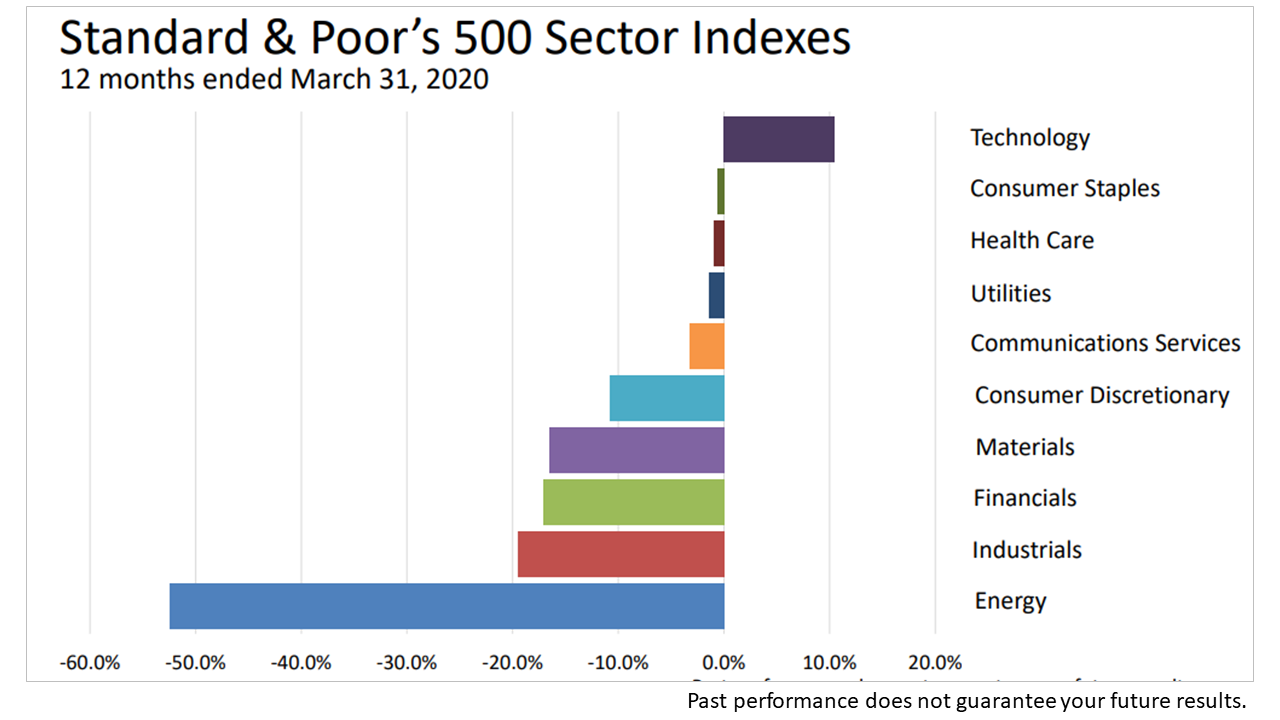
Keep in mind, only a few quarters back, 10 of the 11 industry sectors had suffered huge losses over the previous 12 months.
This was the Covid quarter.
You may remember that the stock market dropped from an all-time high in early February when the outbreak hit, and the S&P 500 had lost 33.9% of its value as of March 23, 2020.
The quarter ended with tech stocks returning a +10.4% profit, but the rest of the stocks across the other 10 industry sectors all lost value in this snapshot from the 12 months ended with that terrible quarter.

Click image to enlarge
The 12-month industry sector returns for the past six quarters illustrate how difficult it is to predict which industry sector will outperform.
With stocks breaking all-time highs month after month, greed and fear—two strong emotions—are likely to make appearances on financial cable TV talking heads, newspaper reports, and, perhaps most insidiously, on social network ad campaigns.
Here is important evidence of how unpredictable the last year has been. It can help you stay focused on a strategic investment plan.
The 12-month returns on the 11 industry sectors that comprise the S&P 500—America’s most valuable 500 publicly investable companies—for the previous six quarters tell a story about how unpredictable stock market investing can be.
For example, with a +62% return for the 12 months ended June 30, 2021, financial sector stocks were the No. 1 performer of the 11 S&P 500 industry sector indexes. And that followed a 12-month return last quarter of +67.5%—more than six times the average annual return in a “normal” year in modern history.
But—and this is a big “but”—financial company equities had lost money in four of the 12-month quarterly periods preceding the second quarter of 2021.
Point is, after suffering 12-month losses four consecutive quarters, could anyone have predicted financials would be a consistent No. 1 performer?
If anyone could do that, would they need your money?
Instead of chasing dreams, please consider the strategy we use—modern portfolio theory—as a framework for portfolio management.

Click image to enlarge
MPT is a large body of financial knowledge based on academic research done over the last 70 years.
This framework for investing is now taught in the world’s best business schools and embraced by institutional investors.
Click image to enlarge
The world that investments revolve around is always changing, and not enough statistical history exists to make investment predictions with certainty.
MPT is a framework for managing that risk.

Click image to enlarge
MPT is a quantitative approach to financial, economic, and statistical facts.
MPT adjusts what’s happened in the past in coming up with an investment outlook based on economic fundamentals.
In addition to classifying investments based on their distinct statistical characteristics, MPT imposes a quantitative discipline for managing assets based on history and fundamental facts about finance.
MPT does not guarantee success, but its logic is embraced by pension funds and other institutional investors.

Click image to enlarge
Over the 12 months, U.S. stocks outperformed major foreign indexes representing stocks in emerging markets, Europe, Asia-Pacific nations, and China.
More about this will follow shortly.
Click image to enlarge
Remember all those bullish TV ads about gold prices that you saw on TV a year ago?
They were wrong!
Even the growing threat of inflation hasn’t made the precious metal shine.
Click image to enlarge
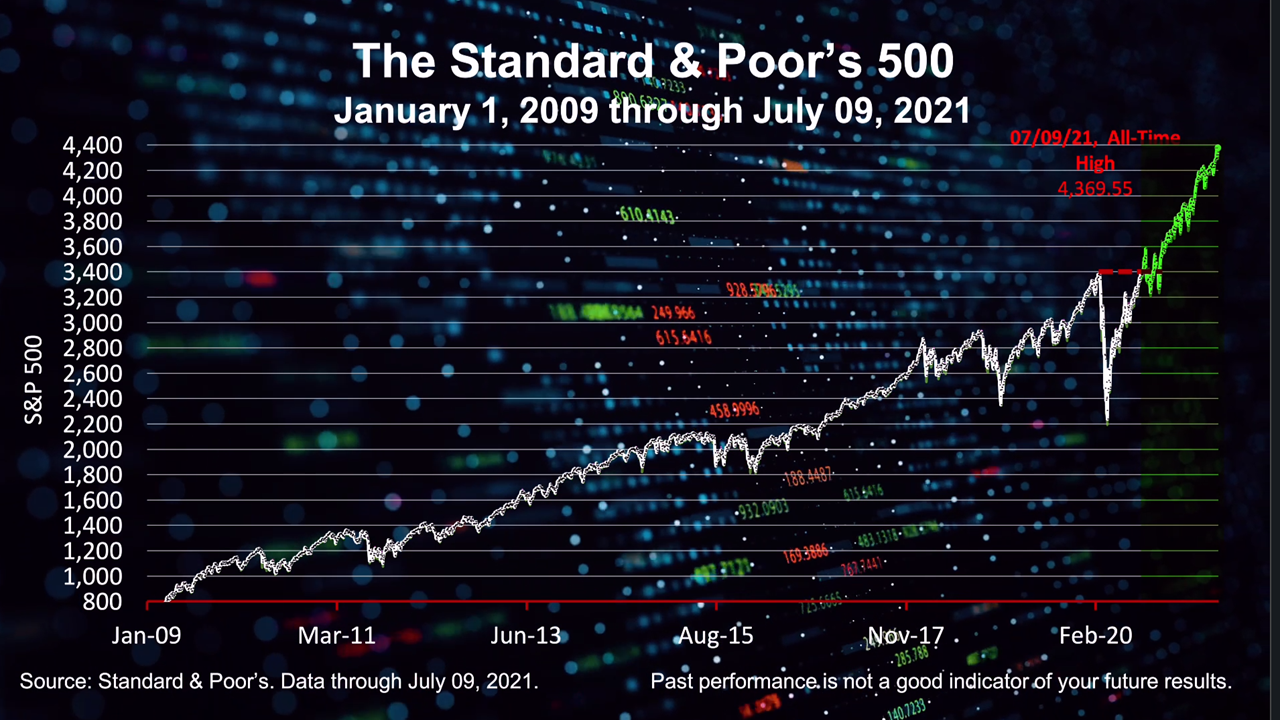
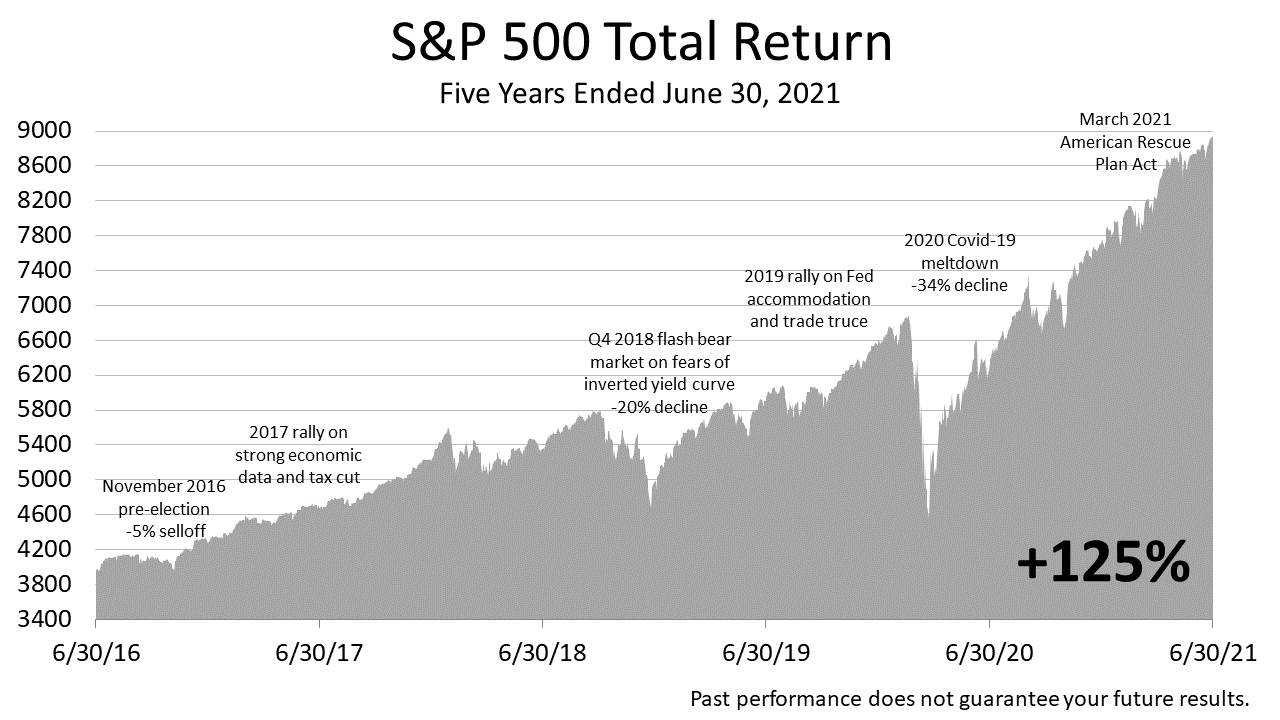
After trading sideways for approximately two years in 2015 and most of 2016—and hitting two air pockets—the stock market broke out of that range after the November 2016 election and rose steadily to an all-time peak on September 20, 2018, whereupon it dove by -20% on investors’ fears that an inverted yield curve was imminent.
On January 4, 2019, the Fed signaled rate hikes were on hold, and stocks rallied for most of the remainder of 2019.
In February of 2020, stocks hit a new all-time peak. Then the Covid-19 virus put the economy and the stock market into meltdown.
By early September of 2020, stocks hit a record all-time high following the enactment of the CARES Act and related legislation.
After a pause, stocks rallied steadily from the November 2020 election through year-end.
The S&P 500 continued upward through the first quarter of 2021 with the March enactment of the $1.9 trillion American Rescue Plan Act, and through the second quarter of 2021.
Over the last five years, including dividends, the S&P 500 Total Return index has gained +125%.
To be clear, the stocks in the Standard & Poor’s 500 index have more than doubled in value in the past five years.
Click image to enlarge
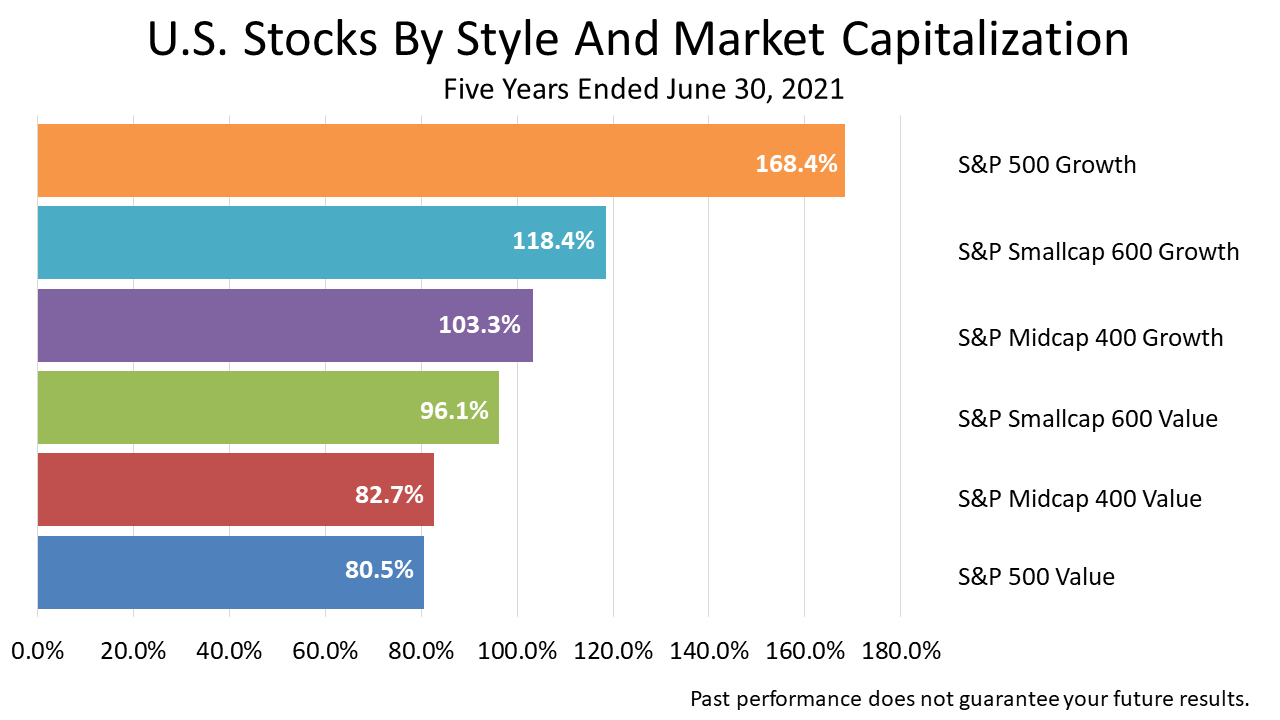
The index representing S&P 500 growth companies, America’s blue-chip stocks, returned $1.68 for every dollar invested for the five years ended June 30, 2021.
The growth index is weighted based on market capitalization, which makes it dominate the performance on the S&P 500 growth stock index.
The five largest growth companies in the S&P 500 accounted for 21% of the total value of the much-watched index at the end of the second quarter of 2021.
Click image to enlarge
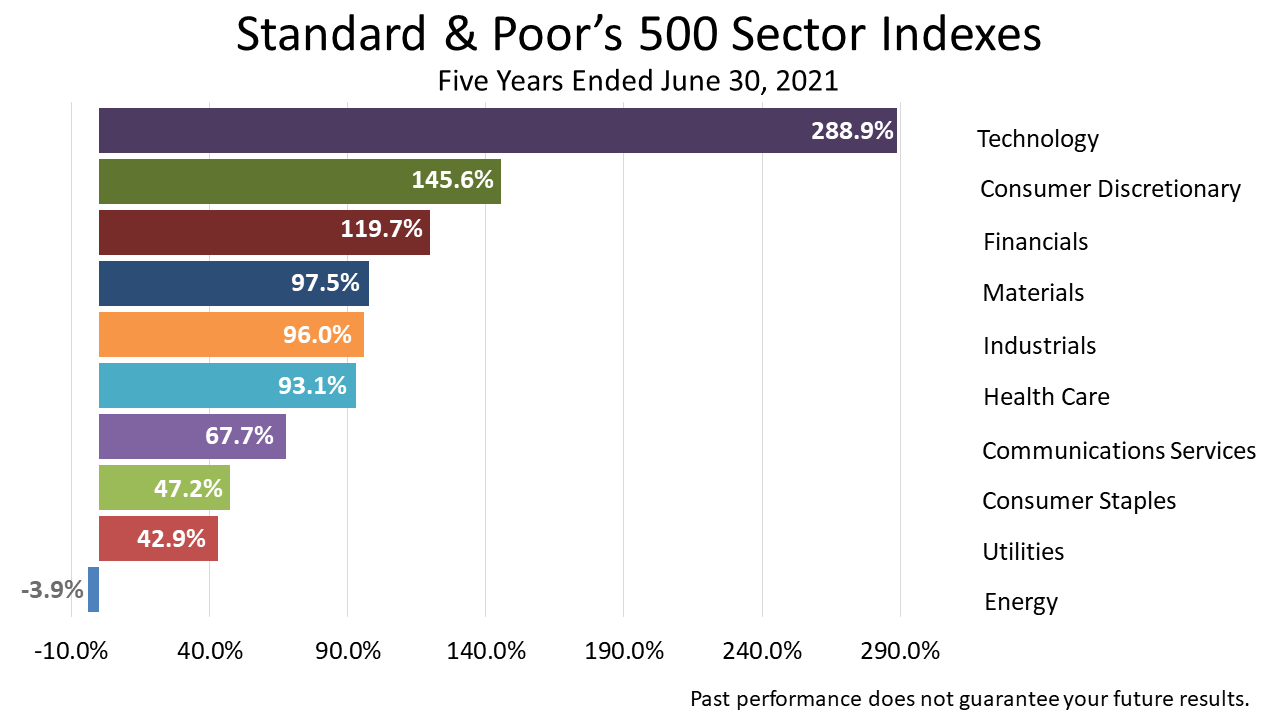
Here, too, the dominance of the five largest companies in five-year industry sector performance.
The technology company stock index nearly tripled in the past five years!
Put another way, If you had invested $1 on May 31, 2016, in the S&P 500, it would have more than doubled in value to $2.25 on June 30, 2021!
Meanwhile, $1 invested in the S&P technology stock index for the same five-year period would have grown to $3.89 on June 30, 2021!
The second-best sector return came from stocks in consumer discretionary companies, but the tech index return was nearly twice as large over the five years.
The 10 other industry sector indexes all trailed technology stocks by wide margins, and the energy index lost 3.9% of its value in this same period!
It begs the question: Are the Big Five tech stocks overvalued?
The answer is no.
To the contrary, they actually may be undervalued.

Click image to enlarge
Of the 500 companies in the S&P 500, the five largest account for 21% of its total value.
Ranked by market capitalization, the five companies are: Apple, Microsoft, Amazon, Google, and Facebook.
They’re all tech companies.
During the pandemic, when we all stayed home, we all became more reliant on these companies and bought more from these companies.
To be clear, of the 500 companies in the S&P 500, the five largest account for 21% of the total value of the much-watched index.
What’s most surprising is that The Big Five are trading at low PEG ratios relative to the other 495 stocks in the S&P 500 index.
The average company in the S&P 500, as of July 9, traded at a PEG ratio of 3.3%, while the Big Five traded at a PEG ratio of just 0.98%—a large discount to the other 500 companies in the S&P 500.
Wikipedia attributes development of the PEG ratio to Mario Farina in a 1969 book. A PEG ratio is a company’s price/earnings ratio divided by its earnings growth rate for the next year. A PEG ratio adjusts the traditional price/earnings metric for valuing a company’s stock by accounting for its expected earnings growth rate.
Curiously, the Big Five look expensive if measured against the S&P 500’s average P/E ratio of 22.8, but the PEG ratio is a better metric to apply because it reflects their expected earnings growth rates, which are of crucial importance to how share prices for these growth stocks are valued in the market.
To be clear, when you look at the earnings growth expected from Amazon—a +73% expected profit growth rate, versus the +7% growth rate expected on the average company in the S&P 500—Amazon looks cheap!
Amazon’s PEG ratio is nine-tenths of 1%, versus the S&P 500’s PEG ratio of 3.3.
Amazon’s trading at a lower PEG ratio than the average stock in the S&P 500!
Stocks are risky investments, and they are volatile.
The S&P 500 has suffered one-day declines of more than 2% recently, and 1% to 2% one-day drops are not uncommon.
Uncertainty about the risk of the Covid-19 variant, as well as inflation, is likely to cause big drops in the S&P 500 in the days ahead.
Yet stocks are the growth engine of a retirement portfolio and are key in a comprehensive tax-smart investment plan built to last the rest of your life.
The table entitled “Valuations Of ‘The Big Five’ Versus S&P 500” was derived from a class for financial professionals by Fritz Meyer, an independent financial economist, on Advisors4Advisors on July 13, 2021.

Click image to enlarge
With volatility high and tax laws about to change, please consider whether the next stock selloff could be a long-term planning opportunity.
Click image to enlarge
Over the five years ended June 30, 2021, the S&P 500 outperformed China’s risky and government-manipulated stock market index, as well as the emerging markets stock index, and it delivered double the return on the Standard & Poor’s European Broad Market Index.
Click image to enlarge
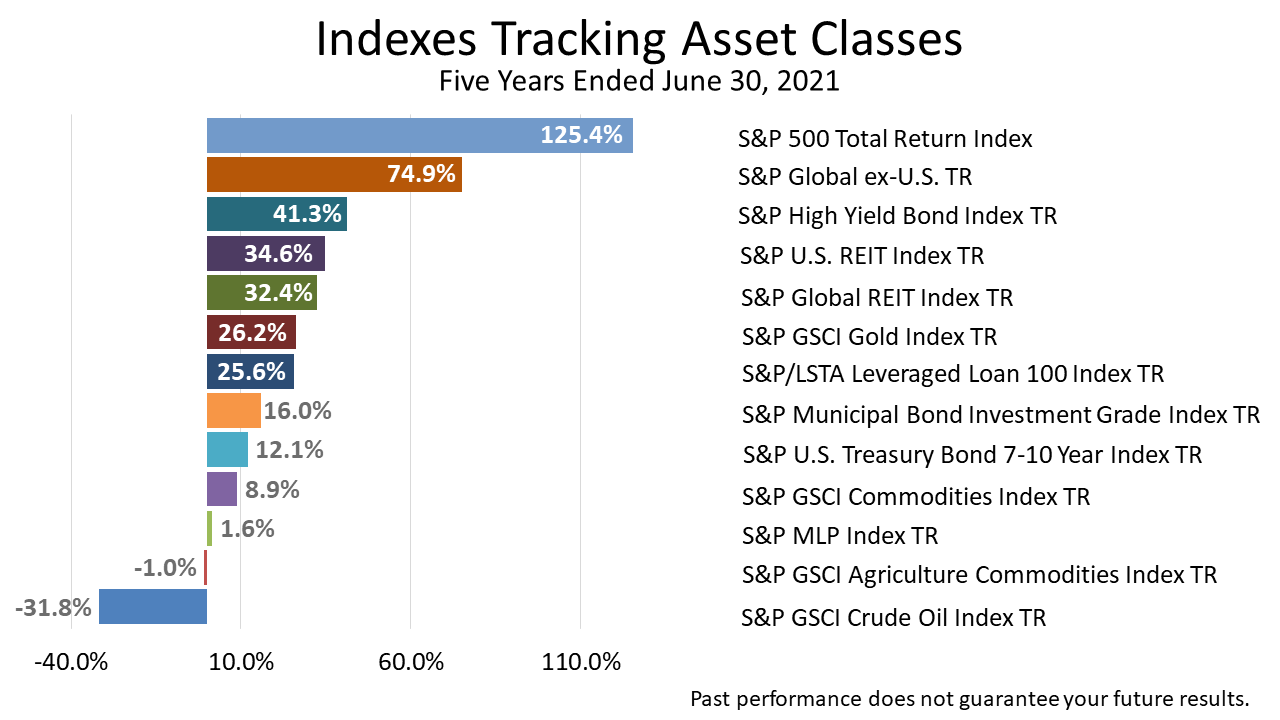
Of 13 indexes tracking a diverse set of asset classes shown here, No. 1 by a large margin for the five years ended June 30, 2021, was the U.S. stock market.
The factors that propelled the outstanding five-year outperformance by U.S. stocks, as measured by the S&P 500, are easily overlooked by Americans but worth reminding you about.

Click image to enlarge
The S&P 500 is the growth engine of portfolios worldwide because the United States is the world’s leading economy, by far.
And it’s not just about having the largest GDP by far; there’s more to it.
The U.S. has the most desirable economic system in the world, by far.
The most valuable public companies in the world are located here, and the U.S. possesses a combination of qualities, including the world’s most:
• well-developed auditing and accounting systems.
• stable government and regulatory structure.
• liquid markets for securities.
•transparent free markets.
• favorable demographics of the major economic powers.
These are facts that investors easily overlook, but they are important fundamentals of returns for U.S. investors.

Click image to enlarge
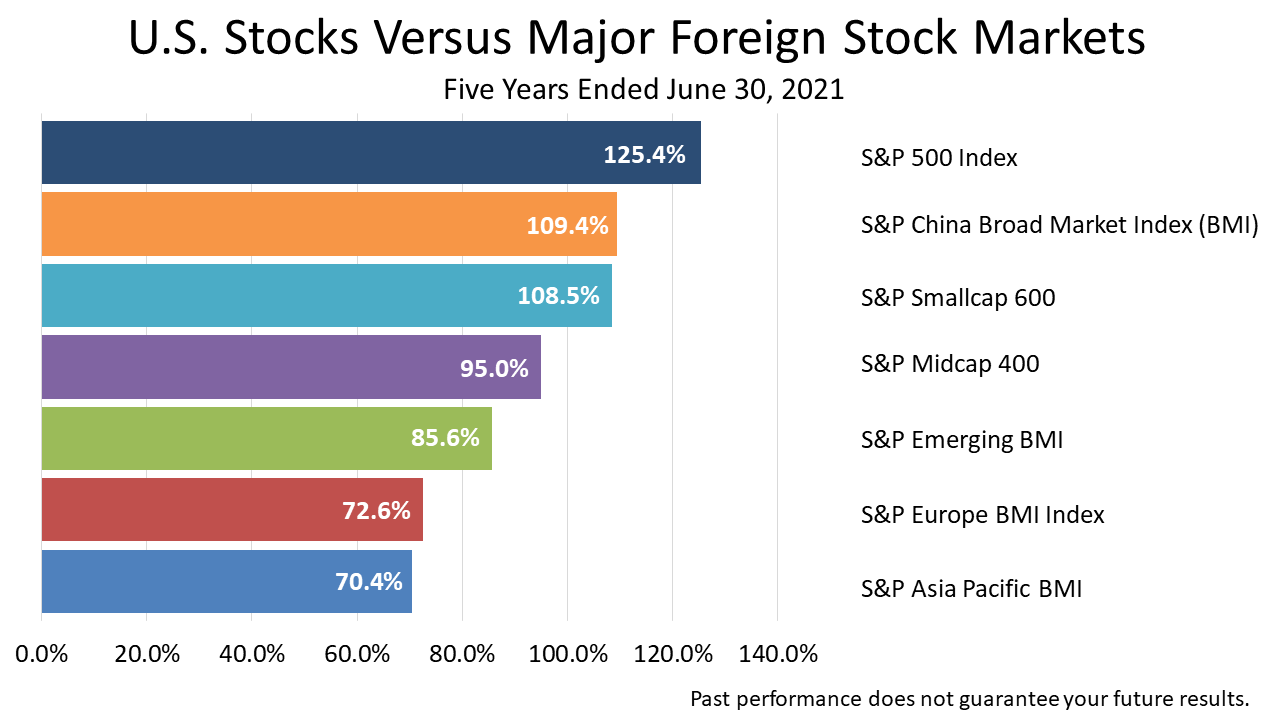
To be clear, this is a diverse group of indexes of securities, and the index representing America’s largest publicly traded companies, the index that is the growth engine of diversified portfolios of investors worldwide, U.S. stocks, returned 125.4% in the five years ended June 30, 2021!
By a huge margin, U.S. stocks were the No. 1 performing of this diverse group of 13 types of securities indexes for this five-year period.
A distant runner up was the 74.9% return on a global index of stocks excluding the U.S.
Click image to enlarge
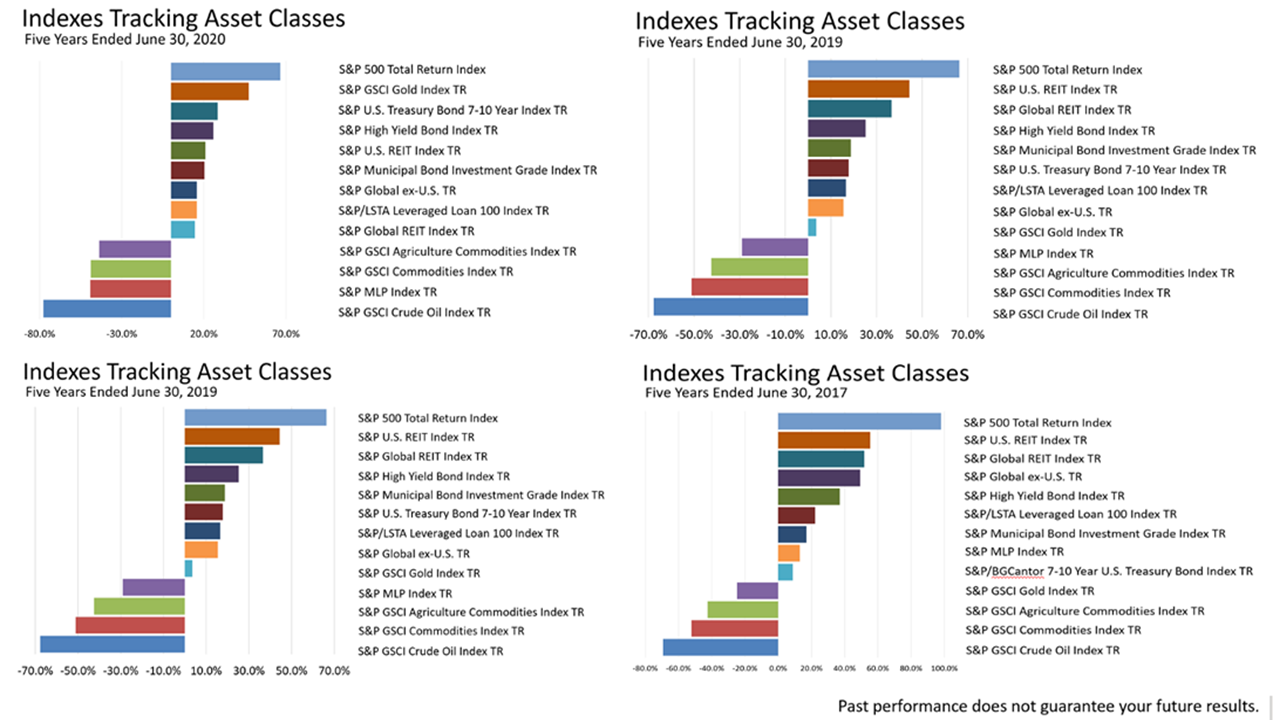
Remarkably, U.S. stocks were not just No. 1 for the five years ended June 30, 2021, but they were the No. 1 performer for the past five five-year periods ended June 30, 2020, 2019, 2018, and 2017!
Every year for the past five years, the U.S. has led the world’s stock markets for the previous five years.
The S&P 500 has been the No.1 five-year investment among 13 different types consistently for five years.
That’s extraordinary!

Click image to enlarge
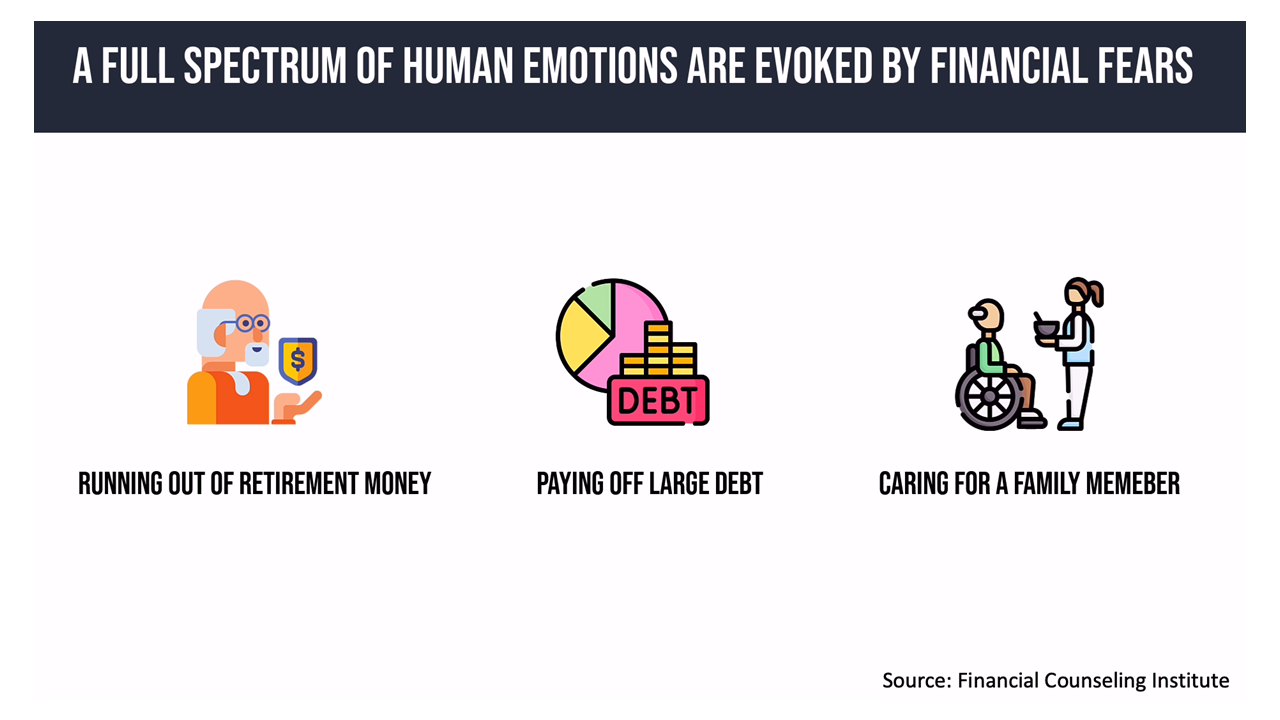
This is precisely the right time to plan for your worst financial nightmare happening.
The stock market has treated American stock investors well year after year, and it could continue.
I’d be lying if I did not say it is possible that the next five years could be as good as the past five great years for stocks.
But I’d also be lying if I did not say that the next five years could be bad for U.S. stocks or that your personal financial situation won’t be subject to drastic change in your business, industry, or Gd-forbid, your health.
Coming out of the first pandemic in a century, the future feels more uncertain than ever, and past performance is no indication of your future investment results.
At the same time, the persistent leadership of U.S. stocks is an important trend driven by financial economic conditions.
Click image to enlarge
With the stock market strong, housing values high, interest rates low, the Fed extremely accommodative and everything going pretty-well, this is the perfect time to plan for your worst nightmare.
Your worst nightmare may be running out of money when you’re aged and no long will want to work, or maybe you stay awake at night worrying about who will care for a child with special needs after you are gone.
But fear comes differently to each of us, depending on how we’re conditioned and hard wired – brain chemistry.
Everyone reacts to stress differently and everyone has their own financial stress triggers.
Some people are prone to panicking in times of high risk.
When Covid hit, when the stock market plunged 33.9% in the six weeks from February 5, 2020, to March 23rd 2020, in those six scary weeks, the price of stocks plunged because some investors panicked.
If you were among those who sold at the bottom and missed the sudden turnaround after those frightening six weeks, or even if you were considering selling everything in stocks during the crisis, there are steps you can take to avoid panicking or worrying about whether you should sell in times of crisis.
For other people, their fear is not panicking in a crisis, it’s a personal fear like losing your job, caring for a special needs child after your death, or paying down a business debt.
Whatever your worst nightmare, this is a good time to articulate it and make a plan for it.
Click image to enlarge