
3Q 2022

Click image to enlarge
THE BEAR MARKET OF 2022
The pandemic, Russian war on Ukraine, soaring inflation, rising interest rates, and growing fears of recession triggered a –4.9% loss in the third quarter, a -16.1% loss in 2Q 2022, and a -4.6% loss in 1Q 2022. On June 13, 2022, the S&P 500 dropped more than -20% from its Jan. 3, 2022, all-time high and a bear market started.

Click image to enlarge
FOUR BEAR MARKETS IN FIVE YEARS
Despite three, consecutive quarterly losses, the S&P 500 stock index over the five years ended September 30, 2022, showed a total return, including dividends, of +55.5%. The period included four bear markets, inlcuding the pandemic meltdown of February and March 2020, when the S&P 500 lost -34% of its value.
Click image to enlarge
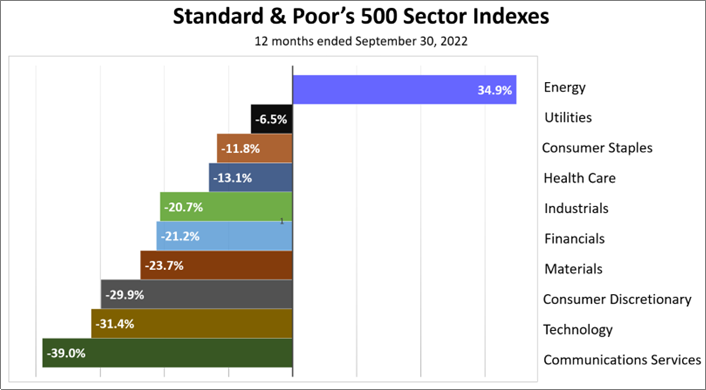
INDUSTRY SECTORS
Higher energy prices propelled energy companies to the top of the 10 industry sectors in the S&P 500 stock index, with a +34.9% return in the 12 months ended September 30. Energy was No. 1 for the past four quarters but it was the worst performer for the five previous quarters starting in 4Q 2019.
Click image to enlarge
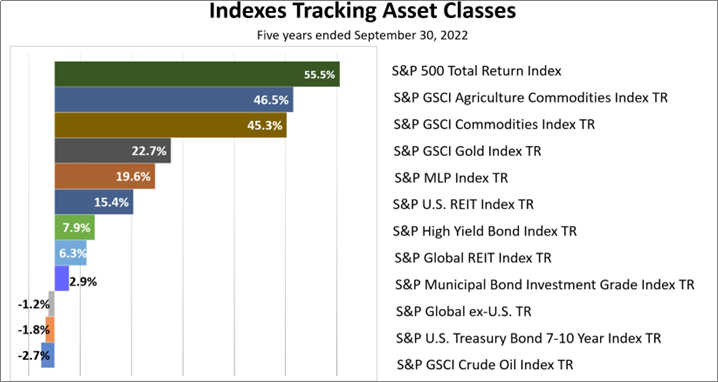
INDEXES TRACKING 13 ASSET CLASSES
Despite the bear market, No. 1 of the broad array of 13 indexes representing investments for the five years ended September 30, 2022, was U.S. stocks. Bonds and foreign equities were laggards. While energy was a leader in the last year, the index of crude oil investments lost -2.7% versus the +55.5% on the S&P 500 index.

Click image to enlarge
VOLATILITY SPIKES
This chart shows all the one-day drops of 3% or more since 2014 in the S&P 500. Since the beginning of 2022, volatility has increased. Without bear markets and spikes in downward volatility, however, investors would not have an opportunity to earn a return in excess of fixed income investments.
Click image to enlarge
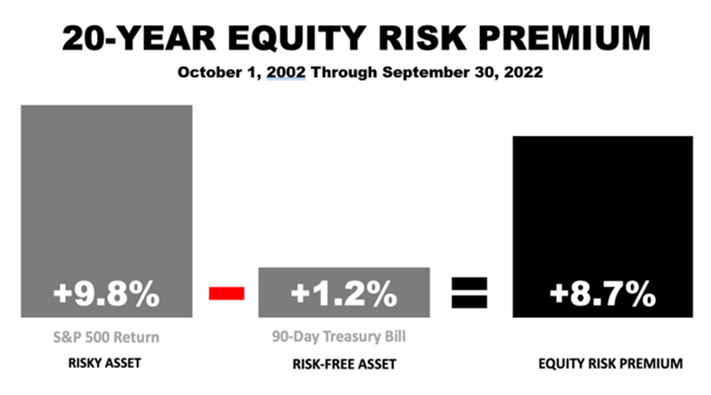
NO SUCH THING AS A FREE LUNCH
Although stocks are a risky asset, subject to periodic bear market drops of 40% or even 50%, they paid a +8.7% premium annually over risk-free 90-day U.S. Treasury Bills for the past 20 years, which included bear markets in 2002, 2008, and early 2020 as well as the 2022 stock market downturn.
Past performance is never a guarantee of your future results. Indices and ETFs representing asset classes are unmanaged and not recommendations. Foreign investing involves currency and political risk and political instability. Bonds offer a fixed rate of return while stocks fluctuate. Investing in emerging markets involves greater risk than investing in more liquid markets with a longer history. Indices are unmanaged and not available for direct investment. Investments with higher return potential carry greater risk of loss. Sources: Sector performance data from Standard and Poor’s. Household net worth data through March 2022 from Federal Reserve Bank of St. Louis, released June 9, 2022; Equity risk premium data from Craig Israelsen, Ph.D, Advisors4Advisors.
2Q 2022

Click image to enlarge
A BEAR MARKET BEGINS
The pandemic, Russian war on Ukraine, soaring inflation, rising interest rates, and growing possibility of a recession led a bear market to begin on June 13, when the S&P 500 dropped more than -20% from its January 3, 2022, all-time high. Stocks posted a -16.1% loss in 2Q 2022, after a -4.6% loss in 1Q 2022.
Click image to enlarge
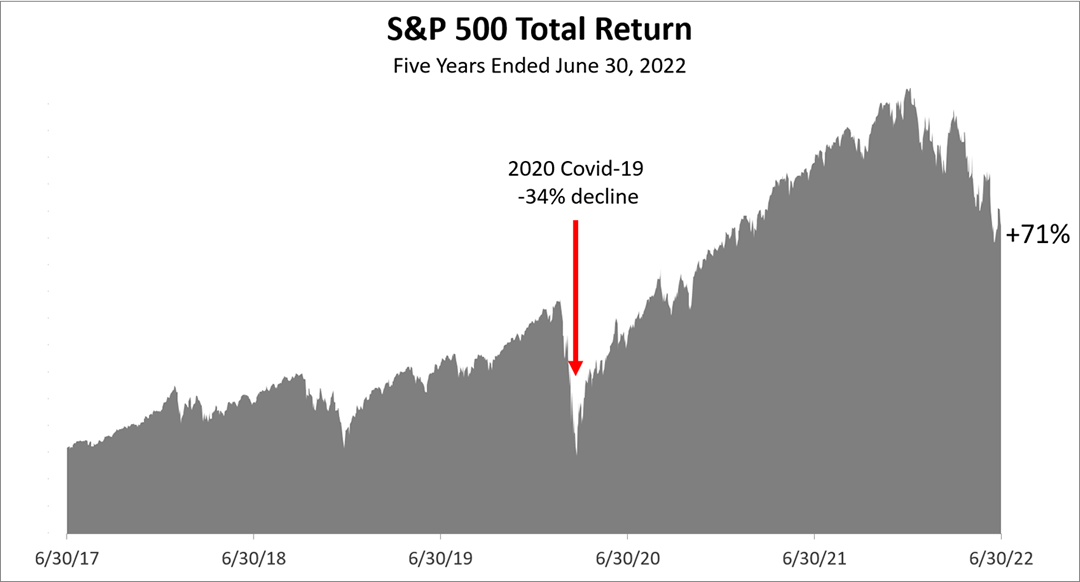
A 12-MONTH WALL OF WORRY
Despite the back to back quarterly losses, the S&P 500 stock index over the five years ended June 30, 2022, showed a total return, including dividends, of +71%. The five year period included the pandemic market meltdown of February and March 2020, when the stock market lost -34% of its value.
Click image to enlarge
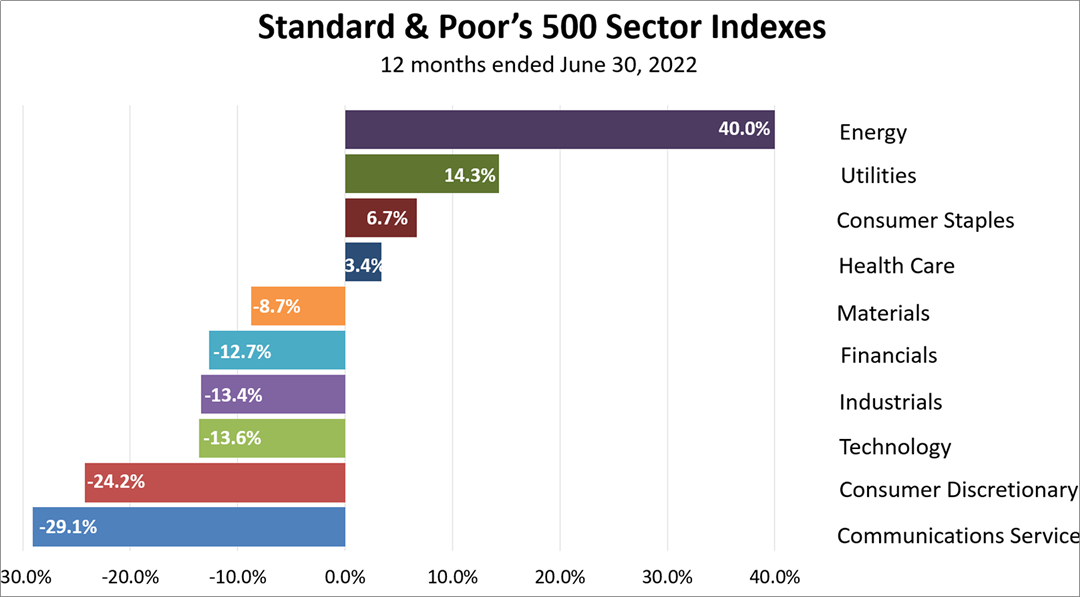
INDUSTRY SECTORS
Higher energy prices propelled energy companies to the top of the 10 industry sectors in the S&P 500 stock index, with a +40% return in the 12 months ended June 30. Energy was No. 1 for the past four quarters but it was the worst performer for the five previous quarters starting in 4Q 2019.
Click image to enlarge
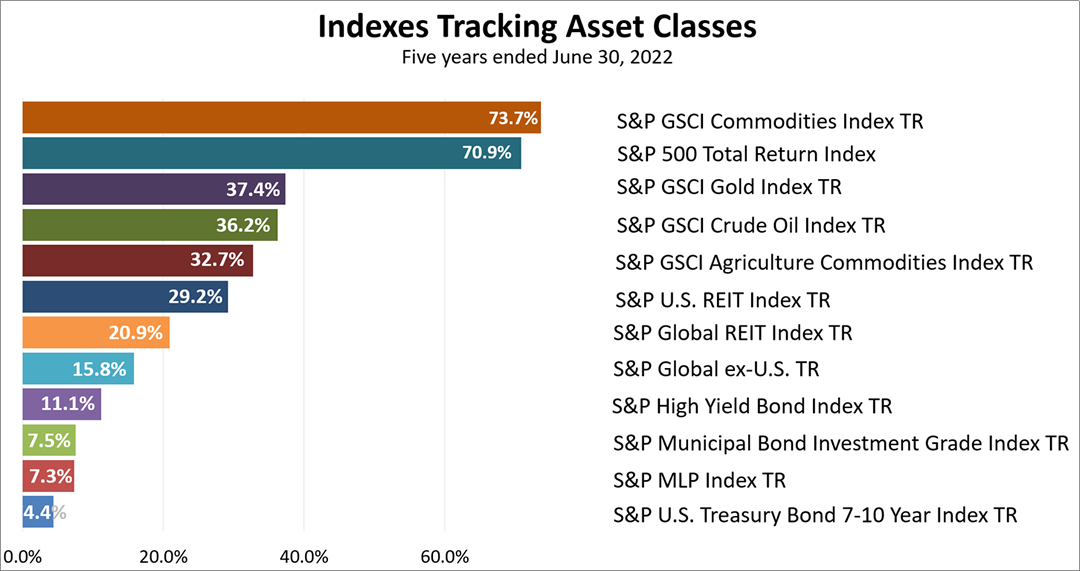
INDEXES TRACKING 13 ASSET CLASSES
Despite being in the throes of a bear market, No. 2 of the broad array of 13 investments for the five years ended June 30 was U.S. stocks. The other top performers were commodity, gold, and energy investments, all of which are more volatile than the S&P 500 index. Bonds and non-U.S. equities lagged by a wide margin.

Click image to enlarge
CONSUMERS ARE IN THE BEST SHAPE EVER
Household net worth surged like never before during the pandemic. Entering this downturn, household balance sheets were exceptionally strong. With consumers accounting for 70% of U.S. economic activity, this unusual support for continued consumer spending, suggests a short, shallow downturn.

Click image to enlarge
NO SUCH THING AS A FREE LUNCH
Amid a bear market, remember this is what you signed signed-up for: a risky asset subject to periodic bear market drops of 40% or even 50%. This is why equities paid a premium over risk-free U.S. Treasury Bills for the past 20 years, which included bear markets in 2002, 2008, and early 2020.
Past performance is never a guarantee of your future results. Indices and ETFs representing asset classes are unmanaged and not recommendations. Foreign investing involves currency and political risk and political instability. Bonds offer a fixed rate of return while stocks fluctuate. Investing in emerging markets involves greater risk than investing in more liquid markets with a longer history. Indices are unmanaged and not available for direct investment. Investments with higher return potential carry greater risk of loss. Sources: Sector performance data from Standard and Poor’s. Household net worth data through March 2022 from Federal Reserve Bank of St. Louis, released June 9, 2022; Equity risk premium data from Craig Israelsen, Ph.D, Advisors4Advisors.
1Q 2022

Click image to enlarge
S&P 500 WIN STREAK SNAPPED
Snapping a seven-quarter win streak, stocks suffered a -4.6% loss in the first quarter of 2022. The last losing quarter for the S&P 500 was the first quarter of 2020, when the pandemic wiped out 20% of the value of stocks. Inflation is at a 40-year high and Ukraine invasion has sent oil prices skyrocketing, hurting stocks.

Click image to enlarge
A 12-MONTH WALL OF WORRY
Despite the first quarter loss of -4.6%, the S&P 500 stock index over the five years ended March 31, 2022, showed a total return, including dividends, gained +110%. The five years included the pandemic market meltdown of February and March 2020, when the stock market lost -34% of its value.

Click image to enlarge
INDUSTRY SECTORS
Rising oil prices fattened profits, sending energy company stocks soaring in value by +64.3%! American energy companies could benefit from a European ban on Russian natural gas and oil, but it will take months for U.S. energy companies to ramp up oil production and exports of natural gas.

Click image to enlarge
INDEXES TRACKING 13 ASSET CLASSES
Of the 13 asset classes represented by indexes, oil was No. 12 over five years — despite its recent surge. Master limited partnerships, heavily weighted in the energy sector, was the worst of this diverse group. The top performer of the broad array of assets was U.S. stocks.

Click image to enlarge
PERSPECTIVE ON THE 1Q22 LOSS
The 10-plus year expansion that erupted after the global financial crisis of 2008 was a period of spectacular calendar-year gains, and it was followed by three great years in 2019, 2020, and 2021. This puts the first-quarter loss of -4.6% on the S&P 500 stock index in proper perspective.

Click image to enlarge
YIELD CURVE
U.S. stocks are always risky. That’s why they paid a premium over riskless Treasury Bills in the 20-years shown, encompassing three frightening bear markets in 2002, 2008, and early 2020. Past performance is no guarantee and that, paradoxically, is precisely why investors are paid a premium for owning stocks.
Past performance is never a guarantee of your future results. Indices and ETFs representing asset classes are unmanaged and not recommendations. Foreign investing involves currency and political risk and political instability. Bonds offer a fixed rate of return while stocks fluctuate. Investing in emerging markets involves greater risk than investing in more liquid markets with a longer history.
4Q 2021
Click image to enlarge
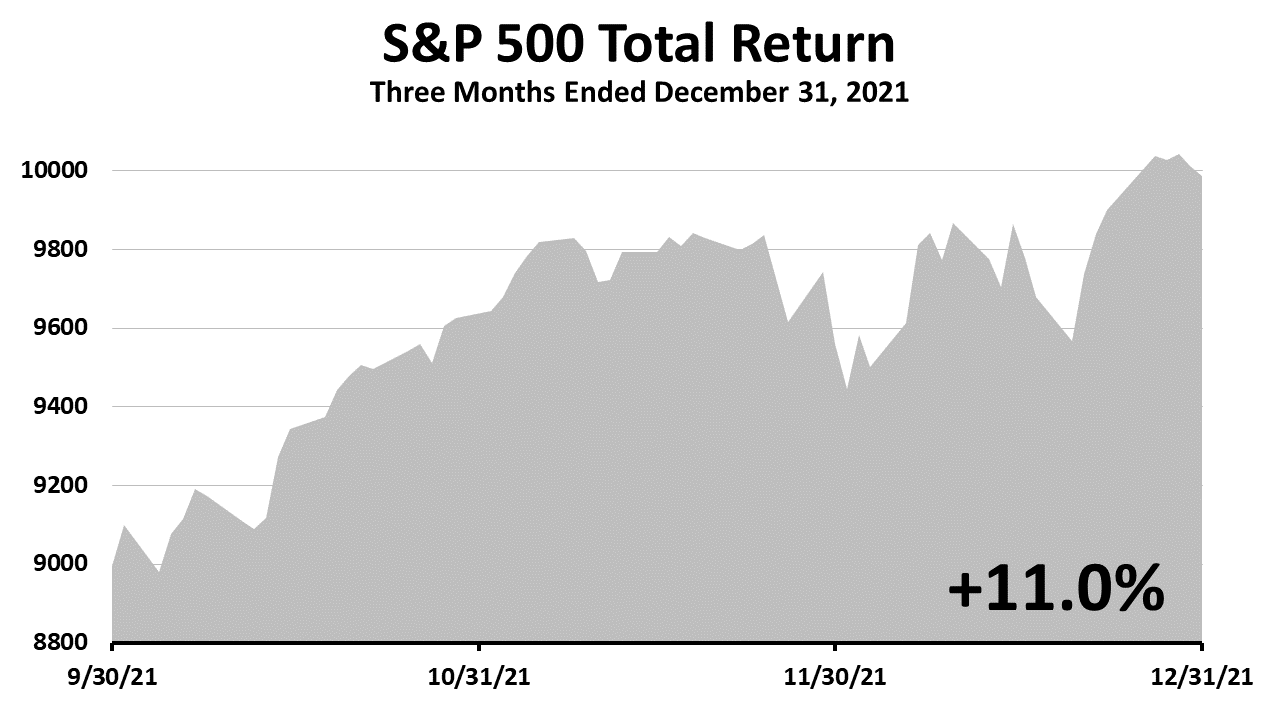
S&P 500 SOARED AGAIN
In the final quarter, the S&P 500 gained 11%. It was the seventh consecutive quarter of gains since the -19.6% quarterly loss in 1Q2020, when the pandemic struck. Between the March 23, 2020 bear market low and end of 4Q2021, the S&P 500 total return, which includes dividends reinvested, was more than 70%.
Click image to enlarge
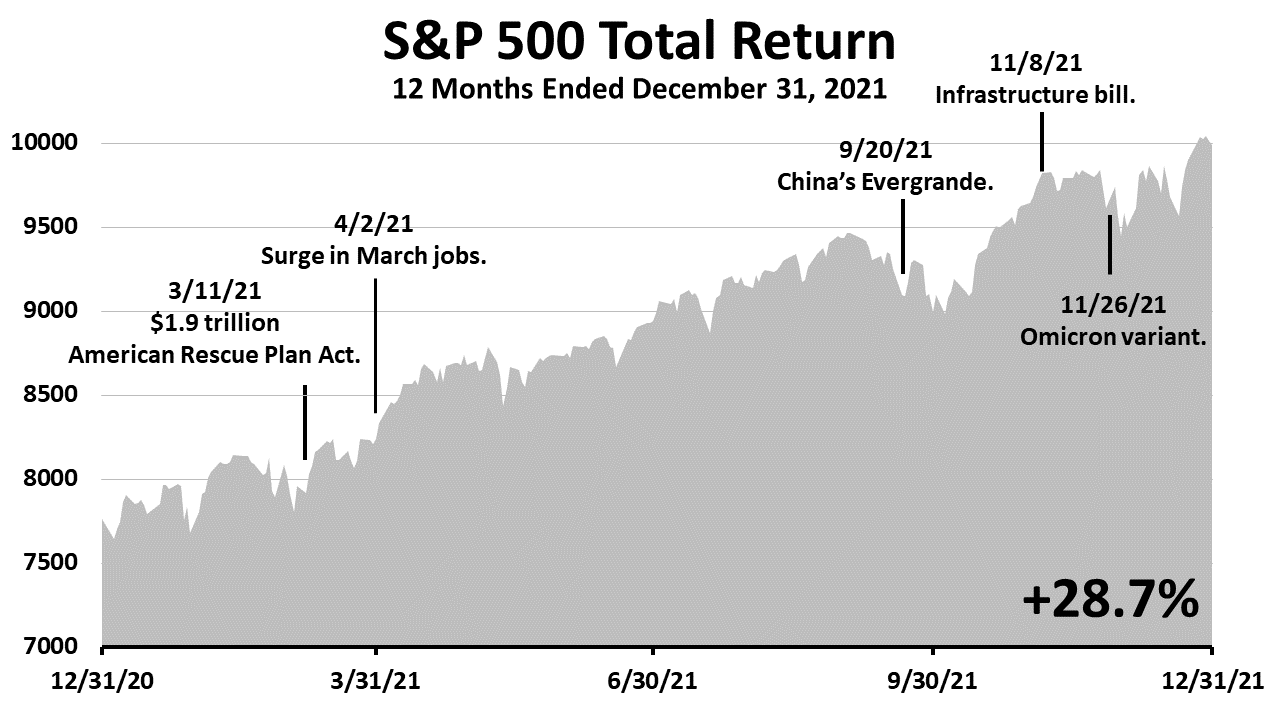
A 12-MONTH WALL OF WORRY
The S&P 500 gained 28.7%% in 2021. The hot economy, fueled by government pandemic aid and the lowest interest rates in U.S. history, drove stocks. With yields on U.S. Treasury bonds negative after inflation, stocks were more attractive than bonds and a new stock valuation paradigm was in place.
Click image to enlarge
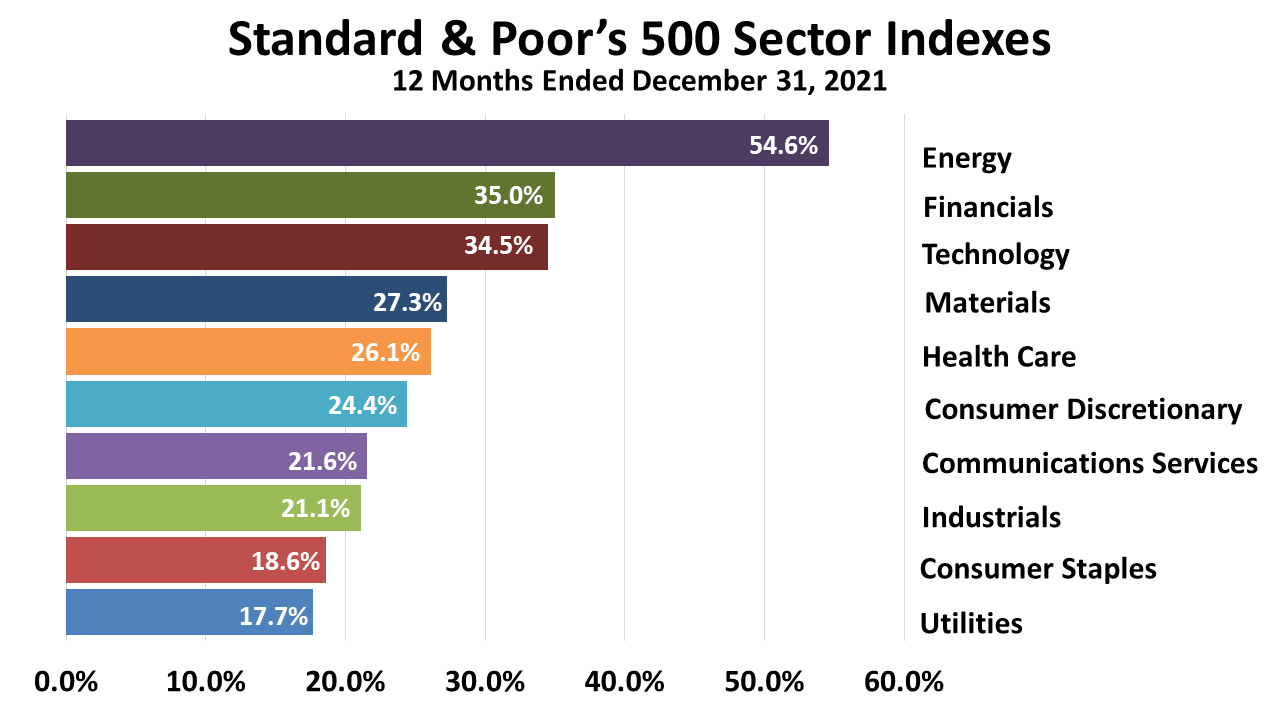
INDUSTRY SECTORS
All 10 industry sector indexes maintained by Standard & Poor’s showed positive returns in 2021. A rebound in oil prices fueled a +54.6% return on the S&P energy stock index in 2021. However, look at how poorly oil indexes performed relative to other investments over five years in the next chart.
Click image to enlarge
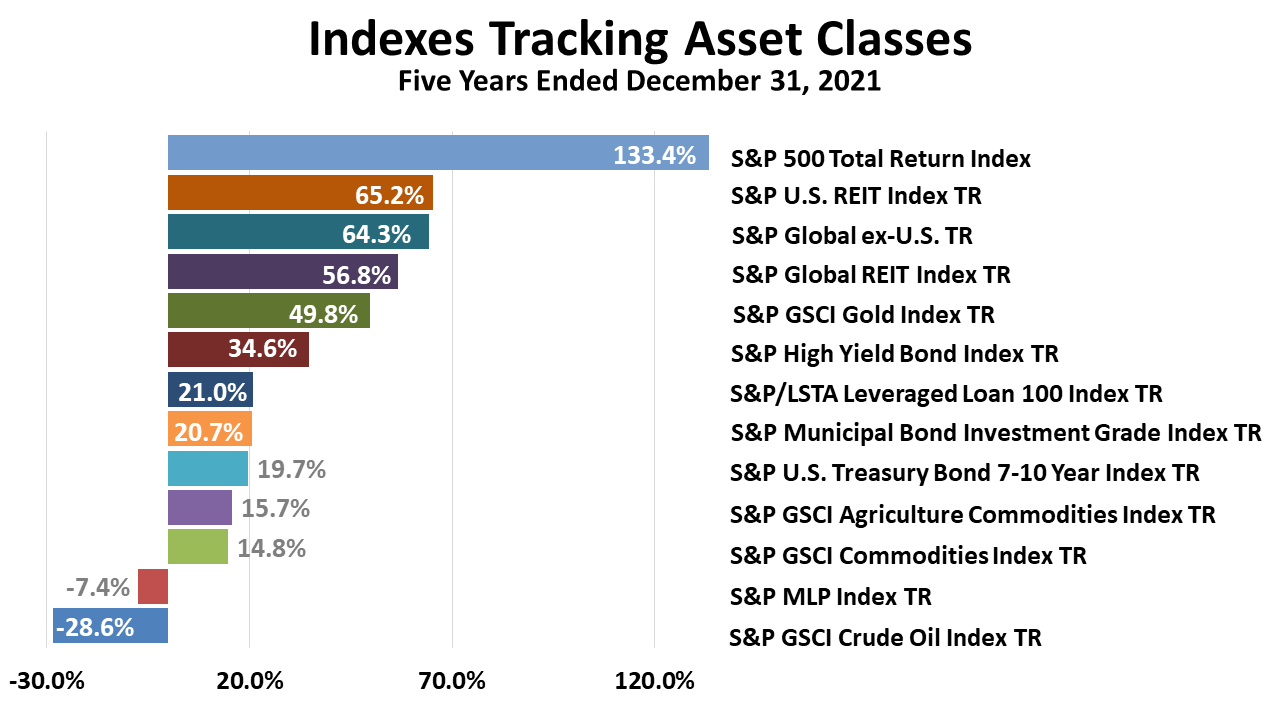
INDEXES TRACKING 13 ASSET CLASSES
Of 13 asset classes represented by indexes here, oil was the biggest loser over five years. Despite a rebound in 2021, oil investments lost -28.6%. Master limited partnerships, heavily weighted in the energy sector, was second-worst. But the main takeaway is the outstanding performance of the broad stock market.

Click image to enlarge
STRONG GROWTH EXPECTED IN 2022
In a big surprise, 4Q2021 growth was 6.9%! It propelled a growth rate for all 2021 of 5.7% — the best growth since 1984! With economists underestimating the strength of the U.S. economy in 4Q2021, it’s likely the consensus forecast for 1Q2022 is also low, making a growth surprise in early 2022 more likely.
Click image to enlarge
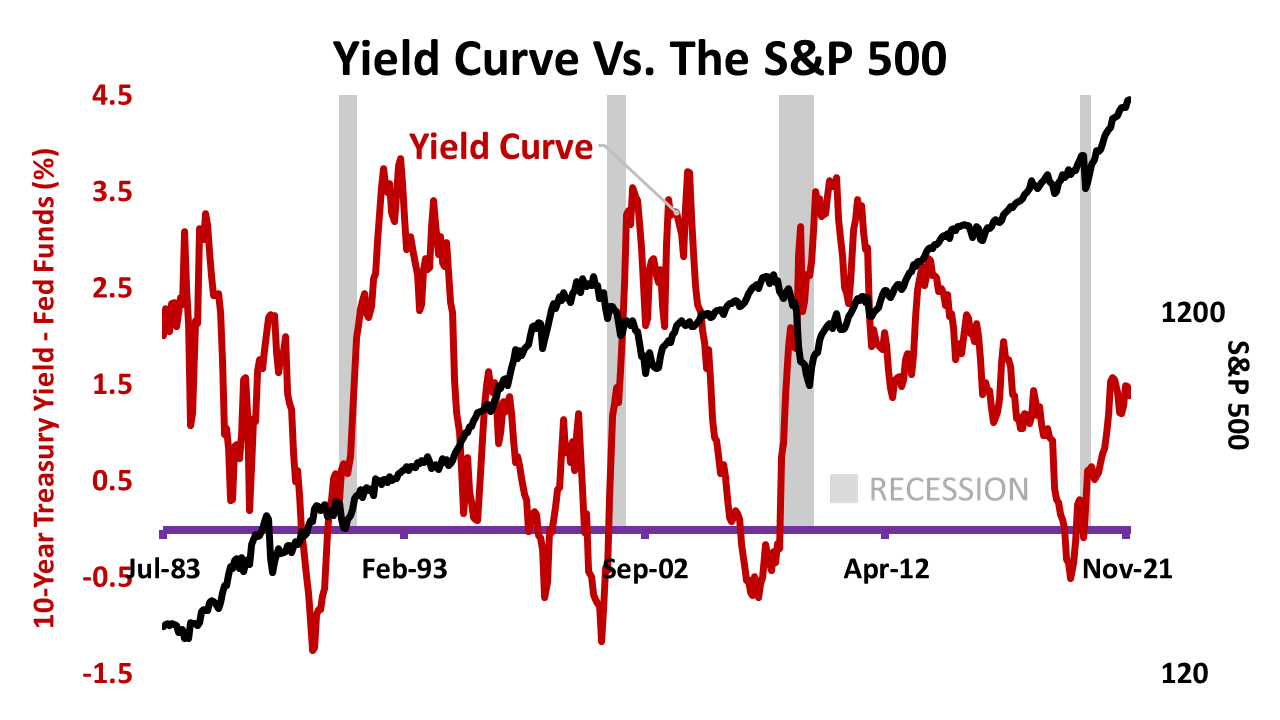
YIELD CURVE
The Federal Reserve Bank has caused every recession in the U.S. since 1950s by inverting the yield curve, making long-term yields fall below short-term yields. At 1.39%, the yield curve is not even close to inverting, and this Fed has been very accommodative for years. A positive yield curve is favorable for continued growth.
Past performance is never a guarantee of your future results. Indices and ETFs representing asset classes are unmanaged and not recommendations. Foreign investing involves currency and political risk and political instability. Bonds offer a fixed rate of return while stocks fluctuate. Investing in emerging markets involves greater risk than investing in more liquid markets with a longer history.
3Q 2021

Click image to enlarge
S&P 500 SOARED AGAIN
For the quarter, the S&P 500 eked out a gain of 0.6%. It was the sixth consecutive quarter of gains since the -19.6% quarterly loss in 1Q2020, when the pandemic struck. Between the March 23, 2020 bear market low and end of 3Q2021, the S&P 500 total return, which includes dividends reinvested, was more than 60%.

Click image to enlarge
A 12-MONTH WALL OF WORRY
The S&P 500 gained 30% in the 12 months ended Sept. 30, 2021. The consumer economy, which accounts for 70% of gross domestic product growth, remained very strong, even as a surge of inflation, supply-chain bottlenecks, and price-to-earnings ratios above the historical norm raised doubts and fears.

Click image to enlarge
INDUSTRY SECTORS
Since the pandemic hit, tech was No. 1 of the 11 S&P 500 industry sectors for four consecutive quarters, but for the last two quarters it was a middling performer. Such shifts in leadership are not reliably predictable, which is one reason why rebalancing your portfolio can be so important.

Click image to enlarge
INDEXES TRACKING 13 ASSET CLASSES
Of these 13 indexes tracking a diverse group of investments, No. 1 by far for the five years ended Sept. 30, 2021, was the S&P 500. That’s why U.S. stocks are the growth engine of retirement portfolios. The S&P global index excluding the U.S. returned half as much as U.S. stocks. It was a difficult period for bonds.

Click image to enlarge
EARNINGS EXPECTED TO RISE
In 2020, actual earnings of the S&P 500 companies were $139.76 per share. Expected earnings in 2021, according to Wall Street analysts’ estimates compiled by Institutional Brokers’ Estimate System (IBES), are $200.64 per share and are expected to shoot up to $219.94 for 2022.

Click image to enlarge
EARNINGS DRIVE STOCK PRICES
To show how earnings drive stock prices, the S&P 500 total Return index is added in the black line. This shows the strong correlation between stock prices and corporate profits. The 2021 and 2022 earnings forecasts, in the red dots, pull the black line higher, demonstrating that earnings drive stock prices.
Past performance is never a guarantee of your future results. Indices and ETFs representing asset classes are unmanaged and not recommendations. Foreign investing involves currency and political risk and political instability. Bonds offer a fixed rate of return while stocks fluctuate. Investing in emerging markets involves greater risk than investing in more liquid markets with a longer history.
2Q 2021
Click image to enlarge
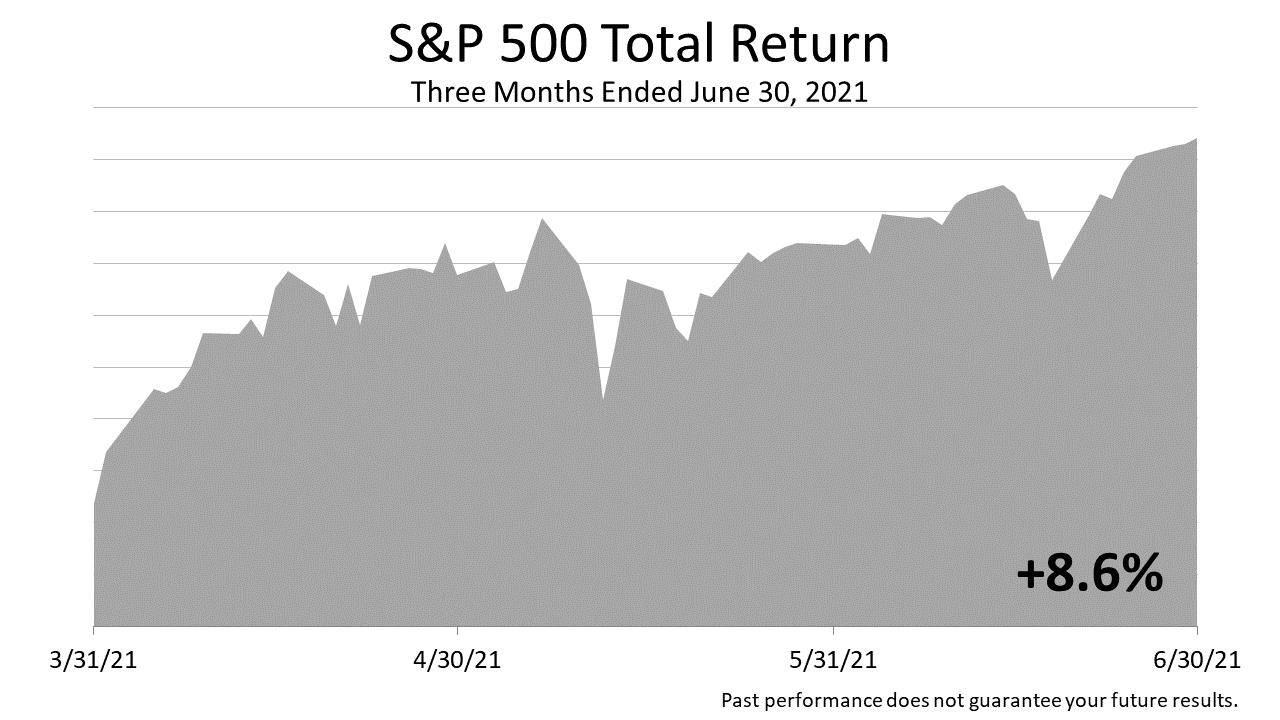
S&P 500 SOARED AGAIN
Stocks posted an +8.6% gain in 2Q2021, after a +6.2% gain in 1Q2021, a +12.2% gain in 4Q2020, an +8.9% gain in 3Q2020 and a +20.5% surge in 2Q2020, which followed the COVID bear market in 1Q2020 of -19.6%. Not only did the S&P 500 recover from the -33.9% COVID bear market loss, but it broke its pre-pandemic high.

Click image to enlarge
20-YEAR EQUITY RISK PREMIUM
The S&P 500 stock index, in the 20 years ended June 30th, 2021, averaged an +8.61% annual return, compared to +1.26% on a risk-free 90-day U.S. Treasury bill. Investors earned a +7.35% premium annually for taking the risk of owning U.S. stocks over the 20-year period. Stocks are risky but have paid off handsomely.
Click image to enlarge
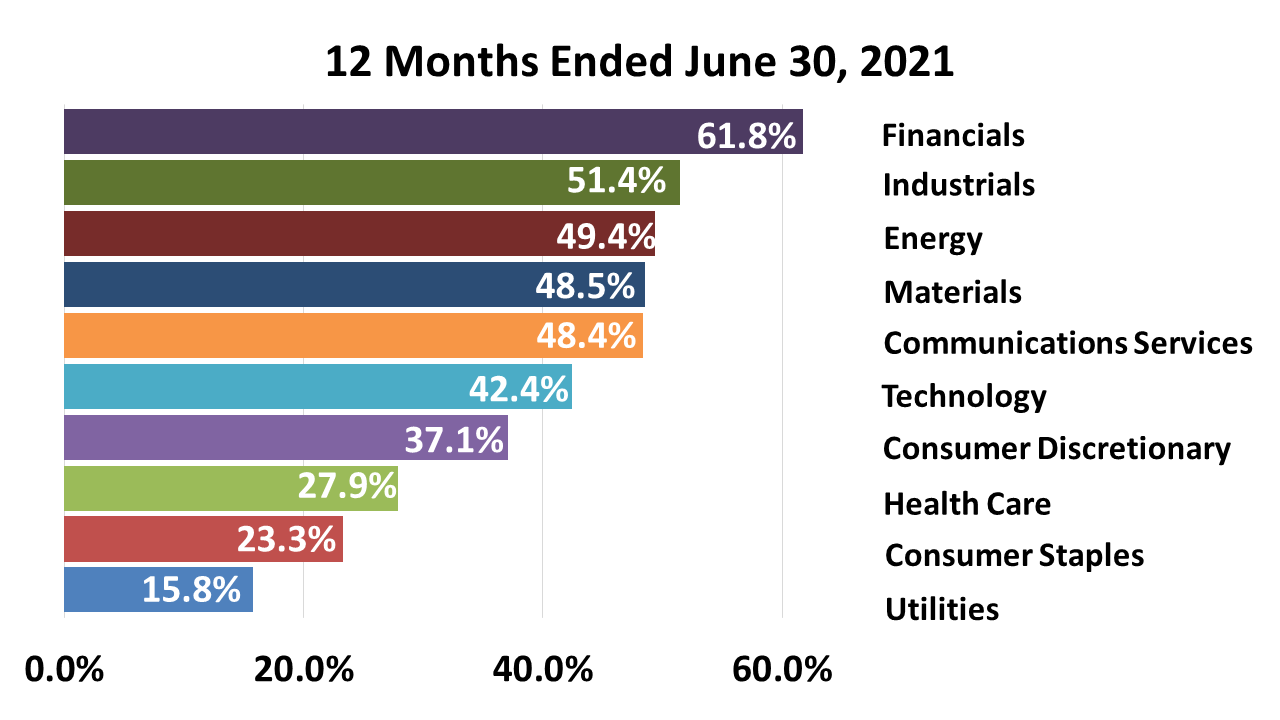
WORST INDUSTRY SECTOR GAINED +15.8%
All 11 industry sectors of the S&P 500 gained sharply in the one-year period ended June 30, 2021. It was the second straight quarter in which all 11 sectors showed positive returns. Despite the unprecedented risks, stocks across all industries delivered returns ranging from outstanding to breathtaking.

Click image to enlarge
INDEXES TRACKING 13 ASSET CLASSES
Of these 13 indexes tracking a diverse group of investments, No. 1 by far for the five years ended June 30, 2021, was the S&P 500. That’s why U.S. stocks are the growth engine of retirement portfolios. Ironically, the factors driving the outperformance by U.S. stocks are easily overlooked by investors.

Click image to enlarge
WHAT DRIVES RETURNS
The S&P 500 is the growth engine of investors worldwide because the U.S. is the world’s leading economy. The U.S. is not just the world’s largest economy, it’s the most stable and dynamic system worldwide in modern history. This is often an overlooked fundamental principle driving portfolio strategy.

Click image to enlarge
BUBBLENESS
The largest five companies in the S&P 500 have been trading at low PEG ratios relative to the other 495 stocks. The average company in the S&P 500, as of July 9, traded at a PEG ratio of 3.3%, while the Big Five traded at a PEG ratio of just 0.98%—a large discount to the other 500 companies in the S&P 500.